


Bitcoin Price Eyes Further Gains Toward $60K: Can It Break Through?
Bitcoin price is holding gains above the $57,500 resistance. BTC is now showing positive signs and might aim for a move toward $60,000. Bitcoin is attempting a fresh increase above the $57,200 support zone. The price is trading above $57,500 and the 100 hourly Simple moving average. There is a key contracting triangle forming with resistance at $58,500 on the hourly chart of the BTC/USD pair (data feed from Kraken). The pair could climb higher if it clears the $58,500 and $58,650 resistance levels in the near term. Bitcoin Price Could Extend Gains Bitcoin price started a decent increase after it broke the $57,000 resistance zone. BTC was able to climb above the $57,500 resistance. The pair even cleared the $58,000 resistance zone. However, the bears seem to be active near the $58,500 resistance zone. A high is formed at $58,450 and the price is now consolidating gains. There was a minor decline below the $58,000 level. The price even dipped below the 23.6% Fib retracement level of the upward move from the $55,550 swing low to the $58,450 high. Bitcoin is now trading above $57,500 and the 100 hourly Simple moving average. On the upside, the price could face resistance near the $58,500 level. There is also a key contracting triangle forming with resistance at $58,500 on the hourly chart of the BTC/USD pair. The first key resistance is near the $58,650 level. A clear move above the $58,650 resistance might start a steady increase in the coming sessions. The next key resistance could be $59,200. A close above the $59,200 resistance might spark more upsides. In the stated case, the price could rise and test the $60,000 resistance. Another Drop In BTC? If Bitcoin fails to rise above the $58,500 resistance zone, it could start another decline. Immediate support on the downside is near the $57,600 level. The first major support is $56,650 or the 61.8% Fib retracement level of the upward move from the $55,550 swing low to the $58,450 high. The next support is now near the $56,220 zone. Any more losses might send the price toward the $55,550 support in the near term. Technical indicators: Hourly MACD – The MACD is now losing pace in the bullish zone. Hourly RSI (Relative Strength Index) – The RSI for BTC/USD is now above the 50 level. Major Support Levels – $57,600, followed by $55,550. Major Resistance Levels – $58,500, and $58,650.

Bitcoin price is holding gains above the $57,500 resistance. BTC is now showing positive signs and might aim for a move toward $60,000.
- Bitcoin is attempting a fresh increase above the $57,200 support zone.
- The price is trading above $57,500 and the 100 hourly Simple moving average.
- There is a key contracting triangle forming with resistance at $58,500 on the hourly chart of the BTC/USD pair (data feed from Kraken).
- The pair could climb higher if it clears the $58,500 and $58,650 resistance levels in the near term.
Bitcoin Price Could Extend Gains
Bitcoin price started a decent increase after it broke the $57,000 resistance zone. BTC was able to climb above the $57,500 resistance. The pair even cleared the $58,000 resistance zone.
However, the bears seem to be active near the $58,500 resistance zone. A high is formed at $58,450 and the price is now consolidating gains. There was a minor decline below the $58,000 level. The price even dipped below the 23.6% Fib retracement level of the upward move from the $55,550 swing low to the $58,450 high.
Bitcoin is now trading above $57,500 and the 100 hourly Simple moving average. On the upside, the price could face resistance near the $58,500 level. There is also a key contracting triangle forming with resistance at $58,500 on the hourly chart of the BTC/USD pair.
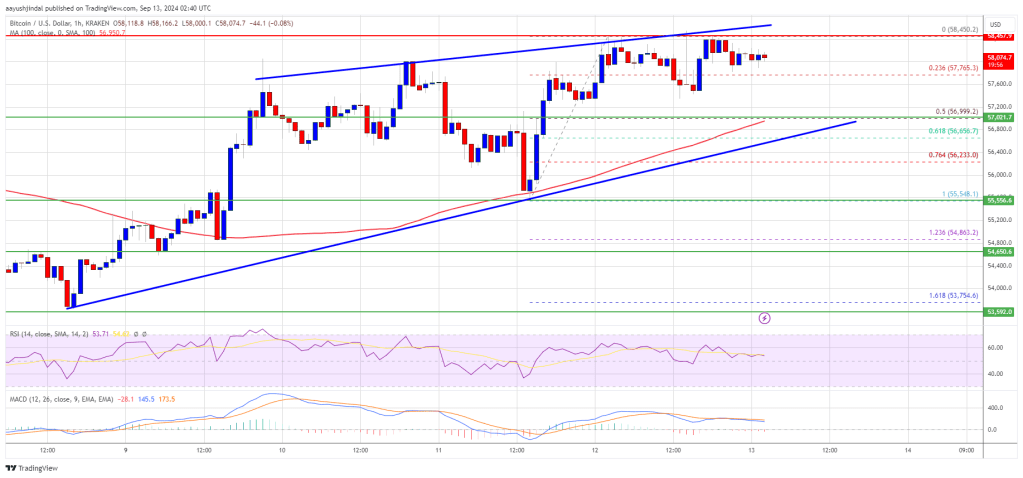
The first key resistance is near the $58,650 level. A clear move above the $58,650 resistance might start a steady increase in the coming sessions. The next key resistance could be $59,200. A close above the $59,200 resistance might spark more upsides. In the stated case, the price could rise and test the $60,000 resistance.
Another Drop In BTC?
If Bitcoin fails to rise above the $58,500 resistance zone, it could start another decline. Immediate support on the downside is near the $57,600 level.
The first major support is $56,650 or the 61.8% Fib retracement level of the upward move from the $55,550 swing low to the $58,450 high. The next support is now near the $56,220 zone. Any more losses might send the price toward the $55,550 support in the near term.
Technical indicators:
Hourly MACD – The MACD is now losing pace in the bullish zone.
Hourly RSI (Relative Strength Index) – The RSI for BTC/USD is now above the 50 level.
Major Support Levels – $57,600, followed by $55,550.
Major Resistance Levels – $58,500, and $58,650.
What's Your Reaction?