
Bitcoin Price Falls Once More: Are Bears Poised for Another Drop?
Bitcoin price started another decline from the $59,500 level. BTC is moving lower, and the bears could gain strength below the $56,000 support. Bitcoin started another decline from the $59,500 resistance zone. The price is trading below $57,500 and the 100 hourly Simple moving average. There is a key declining channel forming with resistance at $58,400 on the hourly chart of the BTC/USD pair (data feed from Kraken). The pair might continue to move down if it fails to stay above the $56,500 support. Bitcoin Price Dips Again Bitcoin price struggled to clear the $59,500 and $60,000 resistance levels. BTC peaked near the $59,500 resistance zone and recently started another decline. There was a move below the $58,500 level. The price declined below the $57,800 and $57,500 support levels. It tested the $56,600 zone. A low was formed at $56,593 and the price is now consolidating losses. It is trading near the 23.6% Fib retracement level of the downward move from the $58,963 swing high to the $56,593 low. Bitcoin price is now trading below $57,500 and the 100 hourly Simple moving average. Immediate resistance on the upside is near the $57,750 level. The first key resistance is near the $58,000 level or the 61.8% Fib retracement level of the downward move from the $58,963 swing high to the $56,593 low. A clear move above the $58,000 resistance might start a decent increase in the coming sessions. The next key resistance could be $58,500. There is also a key declining channel forming with resistance at $58,400 on the hourly chart of the BTC/USD pair. The next major hurdle sits at $59,500. A close above the $59,500 resistance might start a steady increase and send the price higher. In the stated case, the price could rise and test the $60,000 resistance. More Downsides In BTC? If Bitcoin fails to climb above the $58,000 resistance zone, it could continue to move down. Immediate support on the downside is near the $56,600 level. The first major support is $56,000. The next support is now near $55,000. Any more losses might send the price toward the $53,500 support zone in the near term. Technical indicators: Hourly MACD – The MACD is now gaining pace in the bearish zone. Hourly RSI (Relative Strength Index) – The RSI for BTC/USD is now below the 50 level. Major Support Levels – $56,500, followed by $55,000. Major Resistance Levels – $58,000, and $58,500.

Bitcoin price started another decline from the $59,500 level. BTC is moving lower, and the bears could gain strength below the $56,000 support.
- Bitcoin started another decline from the $59,500 resistance zone.
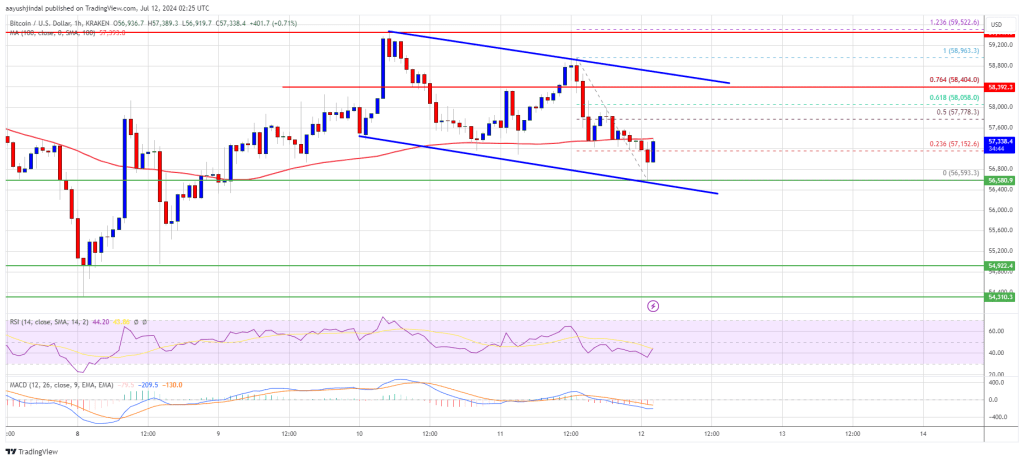
- The price is trading below $57,500 and the 100 hourly Simple moving average.
- There is a key declining channel forming with resistance at $58,400 on the hourly chart of the BTC/USD pair (data feed from Kraken).
- The pair might continue to move down if it fails to stay above the $56,500 support.
Bitcoin Price Dips Again
Bitcoin price struggled to clear the $59,500 and $60,000 resistance levels. BTC peaked near the $59,500 resistance zone and recently started another decline. There was a move below the $58,500 level.
The price declined below the $57,800 and $57,500 support levels. It tested the $56,600 zone. A low was formed at $56,593 and the price is now consolidating losses. It is trading near the 23.6% Fib retracement level of the downward move from the $58,963 swing high to the $56,593 low.
Bitcoin price is now trading below $57,500 and the 100 hourly Simple moving average. Immediate resistance on the upside is near the $57,750 level. The first key resistance is near the $58,000 level or the 61.8% Fib retracement level of the downward move from the $58,963 swing high to the $56,593 low.
A clear move above the $58,000 resistance might start a decent increase in the coming sessions. The next key resistance could be $58,500. There is also a key declining channel forming with resistance at $58,400 on the hourly chart of the BTC/USD pair.
The next major hurdle sits at $59,500. A close above the $59,500 resistance might start a steady increase and send the price higher. In the stated case, the price could rise and test the $60,000 resistance.
More Downsides In BTC?
If Bitcoin fails to climb above the $58,000 resistance zone, it could continue to move down. Immediate support on the downside is near the $56,600 level.
The first major support is $56,000. The next support is now near $55,000. Any more losses might send the price toward the $53,500 support zone in the near term.
Technical indicators:
Hourly MACD – The MACD is now gaining pace in the bearish zone.
Hourly RSI (Relative Strength Index) – The RSI for BTC/USD is now below the 50 level.
Major Support Levels – $56,500, followed by $55,000.
Major Resistance Levels – $58,000, and $58,500.
What's Your Reaction?