


Bitcoin Price Recovery: Here Are Challenges On The Road to Rebound
Bitcoin price is consolidating above the $60,550 support zone. BTC could avoid more downsides if it manages to recover above the $62,400 resistance. Bitcoin is still struggling to recover above the $62,200 and $62,400 levels. The price is trading above $61,500 and the 100 hourly Simple moving average. There was a break above a major bearish trend line with resistance at $61,250 on the hourly chart of the BTC/USD pair (data feed from Kraken). The pair might start another decline unless there is a close above the $62,400 resistance zone. Bitcoin Price Faces Hurdles Bitcoin price struggled to rise above the $62,400 resistance zone. BTC again declined below $62,000, but the bulls were able to protect the $60,550 support. The recent high was formed at $62,297 and the price is now consolidating. Recently, there was a break above a major bearish trend line with resistance at $61,250 on the hourly chart of the BTC/USD pair. It is trading above the 50% Fib retracement level of the upward move from the $60,580 swing low to the $62,297 high. Bitcoin price is now trading above $61,500 and the 100 hourly Simple moving average. If there is another increase, the price could face resistance near the $62,250 level. The first key resistance is near the $62,400 level. The next key resistance could be $62,500. A clear move above the $62,500 resistance might start a steady increase and send the price higher. In the stated case, the price could rise and test the $63,500 resistance. Any more gains might send BTC toward the $64,400 resistance in the near term. Another Decline In BTC? If Bitcoin fails to climb above the $62,400 resistance zone, it could start another decline. Immediate support on the downside is near the $61,450 level and the 100 hourly Simple moving average. The first major support is $61,150 and the 61.8% Fib retracement level of the upward move from the $60,580 swing low to the $62,297 high. The next support is now forming near $60,550. Any more losses might send the price toward the $58,500 support zone in the near term. Technical indicators: Hourly MACD – The MACD is now losing pace in the bearish zone. Hourly RSI (Relative Strength Index) – The RSI for BTC/USD is now above the 50 level. Major Support Levels – $61,150, followed by $60,550. Major Resistance Levels – $62,250, and $62,400.

Bitcoin price is consolidating above the $60,550 support zone. BTC could avoid more downsides if it manages to recover above the $62,400 resistance.
- Bitcoin is still struggling to recover above the $62,200 and $62,400 levels.
- The price is trading above $61,500 and the 100 hourly Simple moving average.
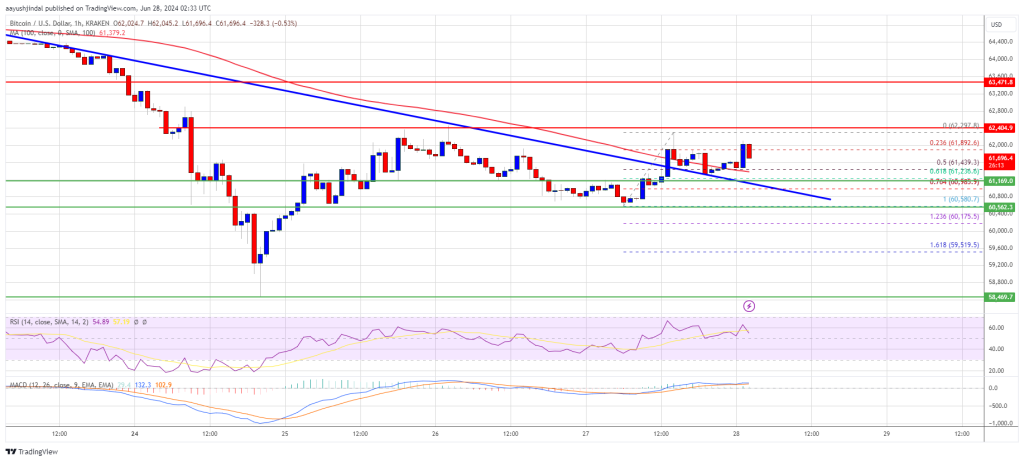
- There was a break above a major bearish trend line with resistance at $61,250 on the hourly chart of the BTC/USD pair (data feed from Kraken).
- The pair might start another decline unless there is a close above the $62,400 resistance zone.
Bitcoin Price Faces Hurdles
Bitcoin price struggled to rise above the $62,400 resistance zone. BTC again declined below $62,000, but the bulls were able to protect the $60,550 support. The recent high was formed at $62,297 and the price is now consolidating.
Recently, there was a break above a major bearish trend line with resistance at $61,250 on the hourly chart of the BTC/USD pair. It is trading above the 50% Fib retracement level of the upward move from the $60,580 swing low to the $62,297 high.
Bitcoin price is now trading above $61,500 and the 100 hourly Simple moving average. If there is another increase, the price could face resistance near the $62,250 level. The first key resistance is near the $62,400 level.
The next key resistance could be $62,500. A clear move above the $62,500 resistance might start a steady increase and send the price higher. In the stated case, the price could rise and test the $63,500 resistance. Any more gains might send BTC toward the $64,400 resistance in the near term.
Another Decline In BTC?
If Bitcoin fails to climb above the $62,400 resistance zone, it could start another decline. Immediate support on the downside is near the $61,450 level and the 100 hourly Simple moving average.
The first major support is $61,150 and the 61.8% Fib retracement level of the upward move from the $60,580 swing low to the $62,297 high. The next support is now forming near $60,550. Any more losses might send the price toward the $58,500 support zone in the near term.
Technical indicators:
Hourly MACD – The MACD is now losing pace in the bearish zone.
Hourly RSI (Relative Strength Index) – The RSI for BTC/USD is now above the 50 level.
Major Support Levels – $61,150, followed by $60,550.
Major Resistance Levels – $62,250, and $62,400.
What's Your Reaction?