


Bitcoin Price Steadies: What Are the Chances of Another Rise?
Bitcoin price struggled to extend gains above the $66,000 resistance level. BTC is consolidating and holding gains above the $63,500 zone. Bitcoin struggled to continue higher above the $66,000 resistance zone. The price is trading above $63,500 and the 100 hourly Simple moving average. There is a key bullish trend line forming with support at $64,000 on the hourly chart of the BTC/USD pair (data feed from Kraken). The pair might continue to move up unless it breaks the $63,500 support zone. Bitcoin Price Holds Gains, Can It Rise Again? Bitcoin price remained in a bullish zone above the $63,500 and $63,800 resistance levels. BTC made another attempt to clear the $66,000 resistance zone. However, the bulls failed to extend gains and the price started a downside correction. There was a drop below the $65,000 and $64,500 levels. The price dipped below the 50% Fib retracement level of the upward move from the $62,465 swing low to the $66,100 high. It found support near the $63,850 zone and the 61.8% Fib retracement level of the upward move from the $62,465 swing low to the $66,100 high. There is also a key bullish trend line forming with support at $64,000 on the hourly chart of the BTC/USD pair. Bitcoin price is now trading above $64,000 and the 100 hourly Simple moving average. If there is a fresh increase, the price could face resistance near the $65,000 level. The first key resistance is near the $66,000 level. A clear move above the $66,000 resistance might spark another increase in the coming sessions. The next key resistance could be $66,500. The next major hurdle sits at $67,200. A close above the $67,200 resistance might push the price further higher. In the stated case, the price could rise and test the $68,000 resistance. More Downsides In BTC? If Bitcoin fails to climb above the $65,000 resistance zone, it could continue to move down. Immediate support on the downside is near the $64,000 level and the trend line. The first major support is $63,850. The next support is now near $63,500. Any more losses might send the price toward the $62,500 support zone in the near term. Technical indicators: Hourly MACD – The MACD is now losing pace in the bullish zone. Hourly RSI (Relative Strength Index) – The RSI for BTC/USD is now near the 50 level. Major Support Levels – $64,000, followed by $63,500. Major Resistance Levels – $65,000, and $66,000.

Bitcoin price struggled to extend gains above the $66,000 resistance level. BTC is consolidating and holding gains above the $63,500 zone.
- Bitcoin struggled to continue higher above the $66,000 resistance zone.
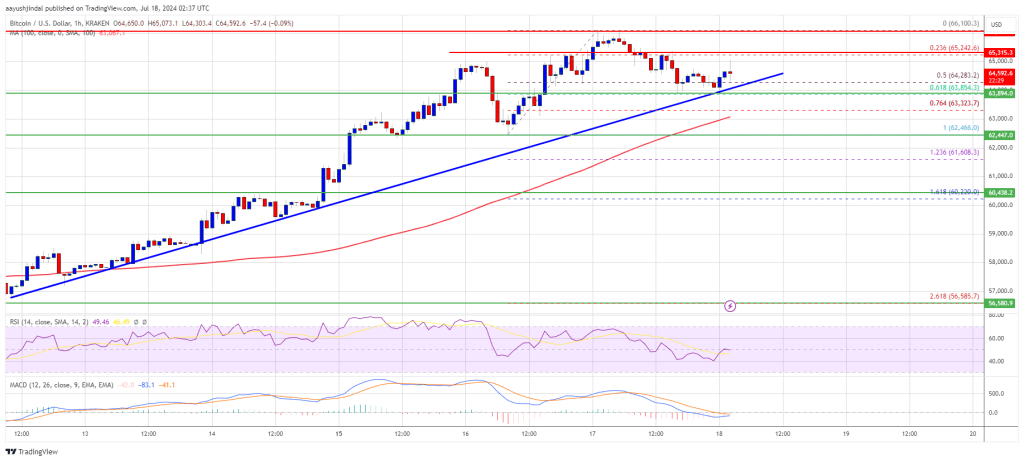
- The price is trading above $63,500 and the 100 hourly Simple moving average.
- There is a key bullish trend line forming with support at $64,000 on the hourly chart of the BTC/USD pair (data feed from Kraken).
- The pair might continue to move up unless it breaks the $63,500 support zone.
Bitcoin Price Holds Gains, Can It Rise Again?
Bitcoin price remained in a bullish zone above the $63,500 and $63,800 resistance levels. BTC made another attempt to clear the $66,000 resistance zone. However, the bulls failed to extend gains and the price started a downside correction.
There was a drop below the $65,000 and $64,500 levels. The price dipped below the 50% Fib retracement level of the upward move from the $62,465 swing low to the $66,100 high.
It found support near the $63,850 zone and the 61.8% Fib retracement level of the upward move from the $62,465 swing low to the $66,100 high. There is also a key bullish trend line forming with support at $64,000 on the hourly chart of the BTC/USD pair.
Bitcoin price is now trading above $64,000 and the 100 hourly Simple moving average. If there is a fresh increase, the price could face resistance near the $65,000 level. The first key resistance is near the $66,000 level.
A clear move above the $66,000 resistance might spark another increase in the coming sessions. The next key resistance could be $66,500. The next major hurdle sits at $67,200. A close above the $67,200 resistance might push the price further higher. In the stated case, the price could rise and test the $68,000 resistance.
More Downsides In BTC?
If Bitcoin fails to climb above the $65,000 resistance zone, it could continue to move down. Immediate support on the downside is near the $64,000 level and the trend line.
The first major support is $63,850. The next support is now near $63,500. Any more losses might send the price toward the $62,500 support zone in the near term.
Technical indicators:
Hourly MACD – The MACD is now losing pace in the bullish zone.
Hourly RSI (Relative Strength Index) – The RSI for BTC/USD is now near the 50 level.
Major Support Levels – $64,000, followed by $63,500.
Major Resistance Levels – $65,000, and $66,000.
What's Your Reaction?