


Bitcoin Price Takes a Plunge: Analyzing the Sudden Drop
Bitcoin price started another decline after it struggled near $64,550. BTC declined below the $63,500 support and might continue to move down. Bitcoin started a fresh decline from the $64,550 resistance level. The price is trading below $63,500 and the 100 hourly Simple moving average. There is a connecting bearish trend line forming with resistance at $63,600 on the hourly chart of the BTC/USD pair (data feed from Kraken). The pair could extend losses if there is a clear move below the $62,700 and $62,500 support levels. Bitcoin Price Dips Further Bitcoin price failed to recover above the $65,000 level. BTC struggled near $64,550 and started another decline. There was a steady decline below the $64,000 and $63,500 levels. The price even declined below the $63,000 level. A low was formed at $62,700 and the price is now consolidating losses. There is also a connecting bearish trend line forming with resistance at $63,600 on the hourly chart of the BTC/USD pair. Bitcoin is now trading below $63,500 and the 100 hourly Simple moving average. If there is a recovery wave, the price could face resistance near the $63,550 level and the 23.6% Fib retracement level of the downward move from the $66,444 swing high to the $62,700 low. The first major resistance could be $64,000. The next key resistance could be $64,500 or the 50% Fib retracement level of the downward move from the $66,444 swing high to the $62,700 low. A clear move above the $64,500 resistance might start a steady increase and send the price higher. In the stated case, the price could rise and test the $65,500 resistance. Any more gains might send BTC toward the $66,200 resistance in the near term. More Downsides In BTC? If Bitcoin fails to climb above the $63,550 resistance zone, it could continue to move down. Immediate support on the downside is near the $62,700 level. The first major support is $62,200. The next support is now forming near $62,000. Any more losses might send the price toward the $61,200 support zone in the near term. Technical indicators: Hourly MACD – The MACD is now gaining pace in the bearish zone. Hourly RSI (Relative Strength Index) – The RSI for BTC/USD is now below the 50 level. Major Support Levels – $62,700, followed by $62,200. Major Resistance Levels – $63,550, and $64,500.

Bitcoin price started another decline after it struggled near $64,550. BTC declined below the $63,500 support and might continue to move down.
- Bitcoin started a fresh decline from the $64,550 resistance level.
- The price is trading below $63,500 and the 100 hourly Simple moving average.
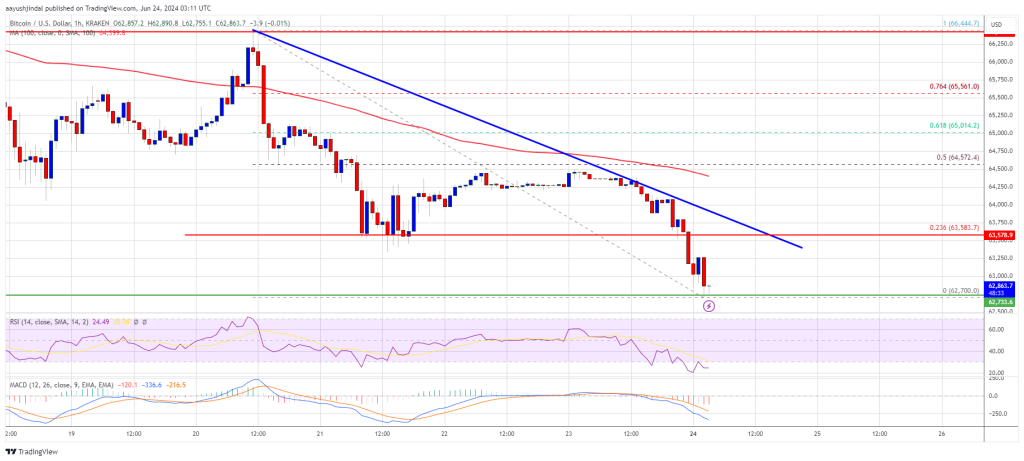
- There is a connecting bearish trend line forming with resistance at $63,600 on the hourly chart of the BTC/USD pair (data feed from Kraken).
- The pair could extend losses if there is a clear move below the $62,700 and $62,500 support levels.
Bitcoin Price Dips Further
Bitcoin price failed to recover above the $65,000 level. BTC struggled near $64,550 and started another decline. There was a steady decline below the $64,000 and $63,500 levels.
The price even declined below the $63,000 level. A low was formed at $62,700 and the price is now consolidating losses. There is also a connecting bearish trend line forming with resistance at $63,600 on the hourly chart of the BTC/USD pair.
Bitcoin is now trading below $63,500 and the 100 hourly Simple moving average. If there is a recovery wave, the price could face resistance near the $63,550 level and the 23.6% Fib retracement level of the downward move from the $66,444 swing high to the $62,700 low.
The first major resistance could be $64,000. The next key resistance could be $64,500 or the 50% Fib retracement level of the downward move from the $66,444 swing high to the $62,700 low.
A clear move above the $64,500 resistance might start a steady increase and send the price higher. In the stated case, the price could rise and test the $65,500 resistance. Any more gains might send BTC toward the $66,200 resistance in the near term.
More Downsides In BTC?
If Bitcoin fails to climb above the $63,550 resistance zone, it could continue to move down. Immediate support on the downside is near the $62,700 level.
The first major support is $62,200. The next support is now forming near $62,000. Any more losses might send the price toward the $61,200 support zone in the near term.
Technical indicators:
Hourly MACD – The MACD is now gaining pace in the bearish zone.
Hourly RSI (Relative Strength Index) – The RSI for BTC/USD is now below the 50 level.
Major Support Levels – $62,700, followed by $62,200.
Major Resistance Levels – $63,550, and $64,500.
What's Your Reaction?