
BNB Price Back on Track: Can It Break $535 to Move Higher?
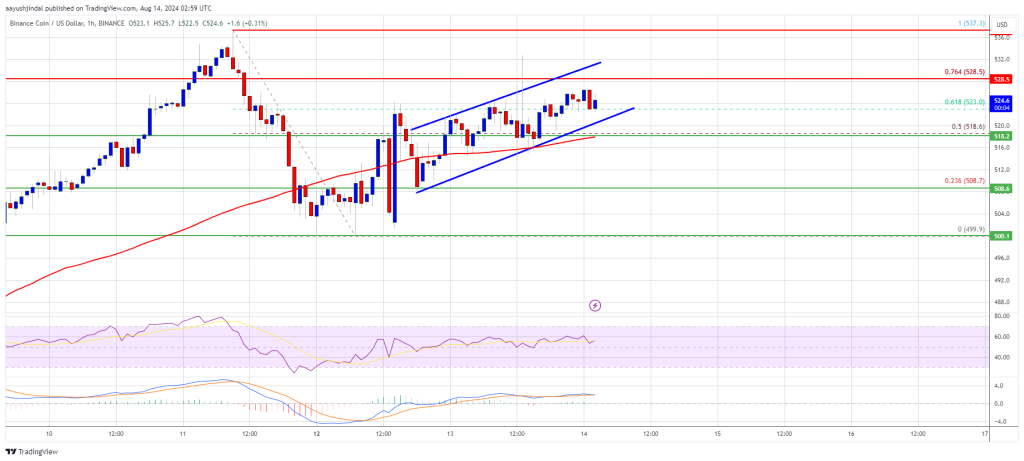
BNB price is recovering higher from the $500 support zone. The price is now showing positive signs and might aim for more upsides above $535. BNB price started a recovery wave from the $500 support zone. The price is now trading above $515 and the 100-hourly simple moving average. There is a key rising channel forming with resistance at $528 on the hourly chart of the BNB/USD pair (data source from Binance). The pair could gain bullish momentum if it clears the $535-$538 resistance zone. BNB Price Eyes More Upsides After forming a base above the $500 level, BNB price started a decent upward move like Ethereum and Bitcoin. The price cleared the $510 and $515 resistance levels to move into a short-term bullish zone. The price surpassed the 50% Fib retracement level of the downward move from the $5376 swing high to the $499 low. It even cleared the $520 resistance. The price is now trading above $515 and the 100-hourly simple moving average. It is now consolidating near the 61% Fib retracement level of the downward move from the $5376 swing high to the $499 low. On the upside, the price could face resistance near the $528 level. There is also a key rising channel forming with resistance at $528 on the hourly chart of the BNB/USD pair. The next resistance sits near the $535 level. A clear move above the $535 zone could send the price higher. In the stated case, BNB price could test $550. A close above the $550 resistance might set the pace for a larger increase toward the $565 resistance. Any more gains might call for a test of the $580 level in the near term. Another Decline? If BNB fails to clear the $535 resistance, it could start another decline. Initial support on the downside is near the $520 level. The next major support is near the $518 level. The main support sits at $508. If there is a downside break below the $508 support, the price could drop toward the $500 support. Any more losses could initiate a larger decline toward the $480 level. Technical Indicators Hourly MACD – The MACD for BNB/USD is gaining pace in the bullish zone. Hourly RSI (Relative Strength Index) – The RSI for BNB/USD is currently above the 50 level. Major Support Levels – $518 and $508. Major Resistance Levels – $528 and $535.

BNB price is recovering higher from the $500 support zone. The price is now showing positive signs and might aim for more upsides above $535.
- BNB price started a recovery wave from the $500 support zone.
- The price is now trading above $515 and the 100-hourly simple moving average.
- There is a key rising channel forming with resistance at $528 on the hourly chart of the BNB/USD pair (data source from Binance).
- The pair could gain bullish momentum if it clears the $535-$538 resistance zone.
BNB Price Eyes More Upsides
After forming a base above the $500 level, BNB price started a decent upward move like Ethereum and Bitcoin. The price cleared the $510 and $515 resistance levels to move into a short-term bullish zone.
The price surpassed the 50% Fib retracement level of the downward move from the $5376 swing high to the $499 low. It even cleared the $520 resistance. The price is now trading above $515 and the 100-hourly simple moving average.
It is now consolidating near the 61% Fib retracement level of the downward move from the $5376 swing high to the $499 low. On the upside, the price could face resistance near the $528 level. There is also a key rising channel forming with resistance at $528 on the hourly chart of the BNB/USD pair.
The next resistance sits near the $535 level. A clear move above the $535 zone could send the price higher. In the stated case, BNB price could test $550. A close above the $550 resistance might set the pace for a larger increase toward the $565 resistance. Any more gains might call for a test of the $580 level in the near term.
Another Decline?
If BNB fails to clear the $535 resistance, it could start another decline. Initial support on the downside is near the $520 level. The next major support is near the $518 level.
The main support sits at $508. If there is a downside break below the $508 support, the price could drop toward the $500 support. Any more losses could initiate a larger decline toward the $480 level.
Technical Indicators
Hourly MACD – The MACD for BNB/USD is gaining pace in the bullish zone.
Hourly RSI (Relative Strength Index) – The RSI for BNB/USD is currently above the 50 level.
Major Support Levels – $518 and $508.
Major Resistance Levels – $528 and $535.
What's Your Reaction?