
BNB Price Faces Challenges: Will It Hold $550 and Bounce Back?
BNB price is struggling to stay above the $550 support zone. The price could start a fresh increase if it clears the $560 resistance zone. BNB price started a fresh decline from the $592 resistance zone. The price is now trading below $565 and the 100-hourly simple moving average. There is a connecting bearish trend line forming with resistance at $560 on the hourly chart of the BNB/USD pair (data source from Binance). The pair could gain bullish momentum if it clears the $560-$562 resistance zone. BNB Price Eyes Recovery After struggling to test the $600 resistance, BNB price started a fresh decline like Ethereum and Bitcoin. The price declined below the $585 and $572 support levels. There was also a move below $560. Finally, the price found support at $548. A low was formed at $547 and the price is now consolidating losses. There is also a connecting bearish trend line forming with resistance at $560 on the hourly chart of the BNB/USD pair. The pair is now trading below $565 and the 100-hourly simple moving average. If there is a recovery wave, the price could face resistance near the $558 level and the trend line. It is close to the 23.6% Fib retracement level of the downward move from the $592 swing high to the $547 low. The next resistance sits near the $562 level. A clear move above the $562 zone could send the price higher. In the stated case, BNB price could test $570 or the 50% Fib retracement level of the downward move from the $592 swing high to the $547 low. A close above the $570 resistance might set the pace for a larger increase toward the $585 resistance. Any more gains might call for a test of the $592 level in the near term. More Downsides? If BNB fails to clear the $560 resistance, it could start another decline. Initial support on the downside is near the $550 level. The next major support is near the $548 level. The main support sits at $542. If there is a downside break below the $542 support, the price could drop toward the $530 support. Any more losses could initiate a larger decline toward the $515 level. Technical Indicators Hourly MACD – The MACD for BNB/USD is losing pace in the bearish zone. Hourly RSI (Relative Strength Index) – The RSI for BNB/USD is currently below the 50 level. Major Support Levels – $550 and $548. Major Resistance Levels – $560 and $570.

BNB price is struggling to stay above the $550 support zone. The price could start a fresh increase if it clears the $560 resistance zone.
- BNB price started a fresh decline from the $592 resistance zone.
- The price is now trading below $565 and the 100-hourly simple moving average.
- There is a connecting bearish trend line forming with resistance at $560 on the hourly chart of the BNB/USD pair (data source from Binance).
- The pair could gain bullish momentum if it clears the $560-$562 resistance zone.
BNB Price Eyes Recovery
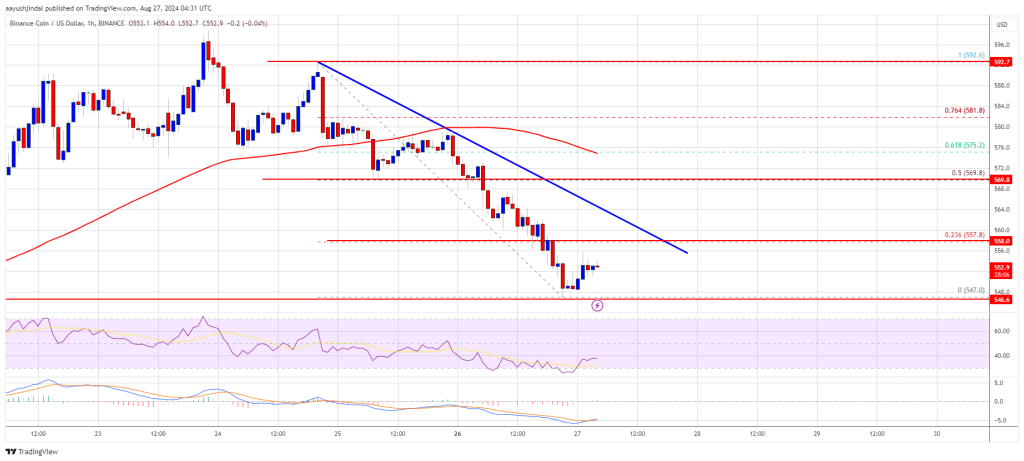
After struggling to test the $600 resistance, BNB price started a fresh decline like Ethereum and Bitcoin. The price declined below the $585 and $572 support levels. There was also a move below $560.
Finally, the price found support at $548. A low was formed at $547 and the price is now consolidating losses. There is also a connecting bearish trend line forming with resistance at $560 on the hourly chart of the BNB/USD pair.
The pair is now trading below $565 and the 100-hourly simple moving average. If there is a recovery wave, the price could face resistance near the $558 level and the trend line. It is close to the 23.6% Fib retracement level of the downward move from the $592 swing high to the $547 low.
The next resistance sits near the $562 level. A clear move above the $562 zone could send the price higher. In the stated case, BNB price could test $570 or the 50% Fib retracement level of the downward move from the $592 swing high to the $547 low.
A close above the $570 resistance might set the pace for a larger increase toward the $585 resistance. Any more gains might call for a test of the $592 level in the near term.
More Downsides?
If BNB fails to clear the $560 resistance, it could start another decline. Initial support on the downside is near the $550 level. The next major support is near the $548 level.
The main support sits at $542. If there is a downside break below the $542 support, the price could drop toward the $530 support. Any more losses could initiate a larger decline toward the $515 level.
Technical Indicators
Hourly MACD – The MACD for BNB/USD is losing pace in the bearish zone.
Hourly RSI (Relative Strength Index) – The RSI for BNB/USD is currently below the 50 level.
Major Support Levels – $550 and $548.
Major Resistance Levels – $560 and $570.
What's Your Reaction?