


Can Cardano (ADA) Reclaims This Resistance and Gain Bullish Momentum?
Cardano (ADA) extended losses and tested the $0.360 zone. ADA is now rising and might attempt to clear the $0.400 resistance zone. ADA price remained in a bearish zone and settled below $0.40. The price is trading below $0.400 and the 100-hourly simple moving average. There is a connecting bullish trend line forming with support at $0.3760 on the hourly chart of the ADA/USD pair (data source from Kraken). The pair could gain bullish momentum if there is a close above $0.400. Cardano Price Remains In Negative Zone In the past few days, Cardano started a downward move like Bitcoin and Ethereum after it failed to clear the $0.450 resistance. ADA dipped below the $0.400 support and tested the $0.360 zone. A low was formed at $0.360 and the price is now correcting losses. There was a minor recovery wave above the $0.3750 zone. The price climbed above the 50% Fib retracement level of the downward move from the $0.4204 swing high to the $0.3600 low. There is also a connecting bullish trend line forming with support at $0.3760 on the hourly chart of the ADA/USD pair. However, the price faces many hurdles on the upside. ADA is still trading below $0.400 and the 100-hourly simple moving average. On the upside, immediate resistance is near the $0.3980 zone or the 61.8% Fib retracement level of the downward move from the $0.4204 swing high to the $0.3600 low. The first resistance is near $0.400. The next key resistance might be $0.410. If there is a close above the $0.410 resistance, the price could start a strong rally. In the stated case, the price could rise toward the $0.4250 region. Any more gains might call for a move toward $0.450. Another Decline in ADA? If Cardano’s price fails to climb above the $0.400 resistance level, it could start another decline. Immediate support on the downside is near the $0.3850 level. The next major support is near the $0.380 level and the trend line. A downside break below the $0.380 level could open the doors for a test of $0.3650. The next major support is near the $0.360 level. Technical Indicators Hourly MACD – The MACD for ADA/USD is gaining momentum in the bullish zone. Hourly RSI (Relative Strength Index) – The RSI for ADA/USD is now above the 50 level. Major Support Levels – $0.3850, $0.380, and $0.360. Major Resistance Levels – $0.400 and $0.4250.

Cardano (ADA) extended losses and tested the $0.360 zone. ADA is now rising and might attempt to clear the $0.400 resistance zone.
- ADA price remained in a bearish zone and settled below $0.40.
- The price is trading below $0.400 and the 100-hourly simple moving average.
- There is a connecting bullish trend line forming with support at $0.3760 on the hourly chart of the ADA/USD pair (data source from Kraken).
- The pair could gain bullish momentum if there is a close above $0.400.
Cardano Price Remains In Negative Zone
In the past few days, Cardano started a downward move like Bitcoin and Ethereum after it failed to clear the $0.450 resistance. ADA dipped below the $0.400 support and tested the $0.360 zone.
A low was formed at $0.360 and the price is now correcting losses. There was a minor recovery wave above the $0.3750 zone. The price climbed above the 50% Fib retracement level of the downward move from the $0.4204 swing high to the $0.3600 low.
There is also a connecting bullish trend line forming with support at $0.3760 on the hourly chart of the ADA/USD pair. However, the price faces many hurdles on the upside.
ADA is still trading below $0.400 and the 100-hourly simple moving average. On the upside, immediate resistance is near the $0.3980 zone or the 61.8% Fib retracement level of the downward move from the $0.4204 swing high to the $0.3600 low.
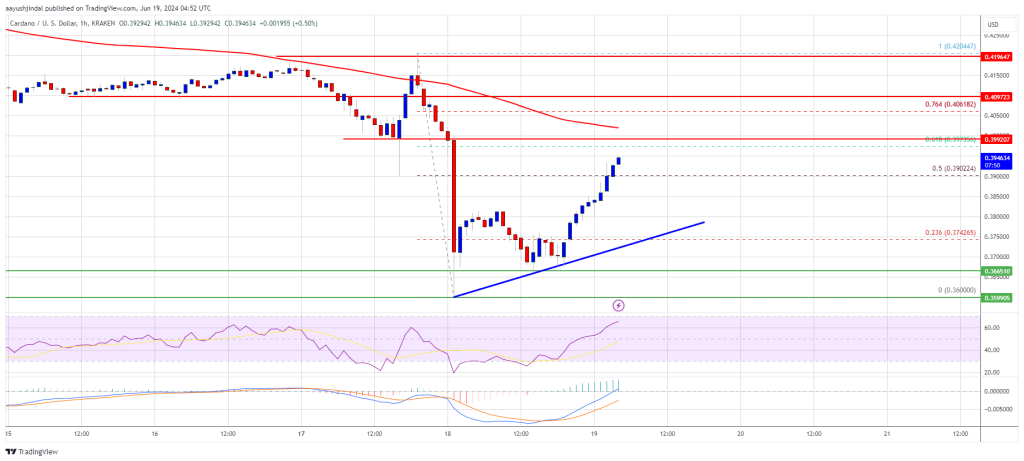
The first resistance is near $0.400. The next key resistance might be $0.410. If there is a close above the $0.410 resistance, the price could start a strong rally. In the stated case, the price could rise toward the $0.4250 region. Any more gains might call for a move toward $0.450.
Another Decline in ADA?
If Cardano’s price fails to climb above the $0.400 resistance level, it could start another decline. Immediate support on the downside is near the $0.3850 level.
The next major support is near the $0.380 level and the trend line. A downside break below the $0.380 level could open the doors for a test of $0.3650. The next major support is near the $0.360 level.
Technical Indicators
Hourly MACD – The MACD for ADA/USD is gaining momentum in the bullish zone.
Hourly RSI (Relative Strength Index) – The RSI for ADA/USD is now above the 50 level.
Major Support Levels – $0.3850, $0.380, and $0.360.
Major Resistance Levels – $0.400 and $0.4250.
What's Your Reaction?