


Cardano (ADA) Faces Fresh Decline: Key Drivers Behind The Downtrend
Cardano price failed to surpass $0.40 and started another decline. ADA is now trading below $0.3850 and might extend losses in the near term. ADA price started a fresh decline and traded below $0.3880. The price is trading below $0.3850 and the 100-hourly simple moving average. There was a break below a key bullish trend line with support at $0.3845 on the hourly chart of the ADA/USD pair (data source from Kraken). The pair could extend losses and test the $0.370 support zone. Cardano Price Dips Again In the past few days, Cardano attempted a recovery wave above the $0.3650 zone like Bitcoin and Ethereum. However, ADA failed to clear the $0.40 resistance zone. A high was formed at $0.3967 and the price started a fresh decline. There was a move below the $0.3880 and $0.3865 support levels. The price declined below the 23.6% Fib retracement level of the upward move from the $0.3620 swing low to the $0.3967 high. Besides, there was a break below a key bullish trend line with support at $0.3845 on the hourly chart of the ADA/USD pair. ADA price is now trading below $0.3850 and the 100-hourly simple moving average. If there is another upward move, the price might face resistance near the $0.3850 zone. The first resistance is near $0.3880. The next key resistance might be $0.40. If there is a close above the $0.40 resistance, the price could start a strong rally. In the stated case, the price could rise toward the $0.4150 region. Any more gains might call for a move toward $0.4250. More Downsides in ADA? If Cardano’s price fails to climb above the $0.3850 resistance level, it could continue to move down. Immediate support on the downside is near the $0.3795 level or the 50% Fib retracement level of the upward move from the $0.3620 swing low to the $0.3967 high. The next major support is near the $0.370 level. A downside break below the $0.370 level could open the doors for a test of $0.350. The next major support is near the $0.3350 level. Technical Indicators Hourly MACD – The MACD for ADA/USD is gaining momentum in the bearish zone. Hourly RSI (Relative Strength Index) – The RSI for ADA/USD is now below the 50 level. Major Support Levels – $0.3790, $0.370, and $0.350. Major Resistance Levels – $0.3880 and $0.400.

Cardano price failed to surpass $0.40 and started another decline. ADA is now trading below $0.3850 and might extend losses in the near term.
- ADA price started a fresh decline and traded below $0.3880.
- The price is trading below $0.3850 and the 100-hourly simple moving average.
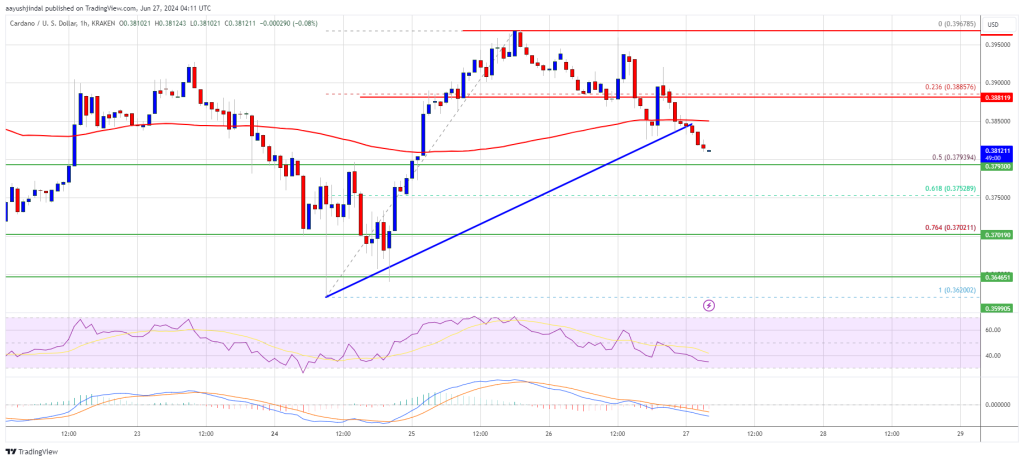
- There was a break below a key bullish trend line with support at $0.3845 on the hourly chart of the ADA/USD pair (data source from Kraken).
- The pair could extend losses and test the $0.370 support zone.
Cardano Price Dips Again
In the past few days, Cardano attempted a recovery wave above the $0.3650 zone like Bitcoin and Ethereum. However, ADA failed to clear the $0.40 resistance zone. A high was formed at $0.3967 and the price started a fresh decline.
There was a move below the $0.3880 and $0.3865 support levels. The price declined below the 23.6% Fib retracement level of the upward move from the $0.3620 swing low to the $0.3967 high. Besides, there was a break below a key bullish trend line with support at $0.3845 on the hourly chart of the ADA/USD pair.
ADA price is now trading below $0.3850 and the 100-hourly simple moving average. If there is another upward move, the price might face resistance near the $0.3850 zone.
The first resistance is near $0.3880. The next key resistance might be $0.40. If there is a close above the $0.40 resistance, the price could start a strong rally. In the stated case, the price could rise toward the $0.4150 region. Any more gains might call for a move toward $0.4250.
More Downsides in ADA?
If Cardano’s price fails to climb above the $0.3850 resistance level, it could continue to move down. Immediate support on the downside is near the $0.3795 level or the 50% Fib retracement level of the upward move from the $0.3620 swing low to the $0.3967 high.
The next major support is near the $0.370 level. A downside break below the $0.370 level could open the doors for a test of $0.350. The next major support is near the $0.3350 level.
Technical Indicators
Hourly MACD – The MACD for ADA/USD is gaining momentum in the bearish zone.
Hourly RSI (Relative Strength Index) – The RSI for ADA/USD is now below the 50 level.
Major Support Levels – $0.3790, $0.370, and $0.350.
Major Resistance Levels – $0.3880 and $0.400.
What's Your Reaction?