


Chainlink Signals Upside Break: Analyzing LINK’s Bullish Indicators
Chainlink’s LINK price is recovering from the $12.65 support. The price is gaining bullish momentum and might aim for a move above the $14.20 resistance. Chainlink price is showing bullish signs and eyeing more gains above $14.00 against the US dollar. The price is trading above the $13.50 level and the 100-hourly simple moving average. There was a break above a major bearish trend line with resistance near $13.60 on the hourly chart of the LINK/USD pair (data source from Kraken). The price could extend gains if it clears the $14.20 resistance zone. Chainlink Price Turns Green In the past few sessions, Chainlink saw a decent upward move from the $12.65 zone. There was a move above the $13.00 and $13.20 levels. LINK bulls are now attempting a steady upward move like Ethereum. There was a clear move above the 50% Fib retracement level of the downward move from the $14.82 swing high to the $12.66 low. There was also a break above a major bearish trend line with resistance near $13.60 on the hourly chart of the LINK/USD pair. Chainlink is now trading above the $13.50 level and the 100-hourly simple moving average. Immediate resistance is near the $14.05 level or the 61.8% Fib retracement level of the downward move from the $14.82 swing high to the $12.66 low. The next major resistance is near the $14.20 zone. A clear break above $14.20 may possibly start a steady increase toward the $14.50 level. The next major resistance is near the $14.80 level, above which the price could test $15.00. Any more gains might send the price toward the $15.50 resistance level in the coming sessions. Are Dips Limited In LINK? If Chainlink’s price fails to climb above the $14.20 resistance level, there could be a downside correction. Initial support on the downside is near the $13.80 level. The next major support is near the $13.65 level or the 100-hourly simple moving average, below which the price might test the $13.50 level. Any more losses could lead LINK toward the $12.90 level in the near term. Technical Indicators Hourly MACD – The MACD for LINK/USD is gaining momentum in the bullish zone. Hourly RSI (Relative Strength Index) – The RSI for LINK/USD is now above the 50 level. Major Support Levels – $13.80 and $13.50. Major Resistance Levels – $14.20 and $14.50.

Chainlink’s LINK price is recovering from the $12.65 support. The price is gaining bullish momentum and might aim for a move above the $14.20 resistance.
- Chainlink price is showing bullish signs and eyeing more gains above $14.00 against the US dollar.
- The price is trading above the $13.50 level and the 100-hourly simple moving average.
- There was a break above a major bearish trend line with resistance near $13.60 on the hourly chart of the LINK/USD pair (data source from Kraken).
- The price could extend gains if it clears the $14.20 resistance zone.
Chainlink Price Turns Green
In the past few sessions, Chainlink saw a decent upward move from the $12.65 zone. There was a move above the $13.00 and $13.20 levels. LINK bulls are now attempting a steady upward move like Ethereum.
There was a clear move above the 50% Fib retracement level of the downward move from the $14.82 swing high to the $12.66 low. There was also a break above a major bearish trend line with resistance near $13.60 on the hourly chart of the LINK/USD pair.
Chainlink is now trading above the $13.50 level and the 100-hourly simple moving average. Immediate resistance is near the $14.05 level or the 61.8% Fib retracement level of the downward move from the $14.82 swing high to the $12.66 low.
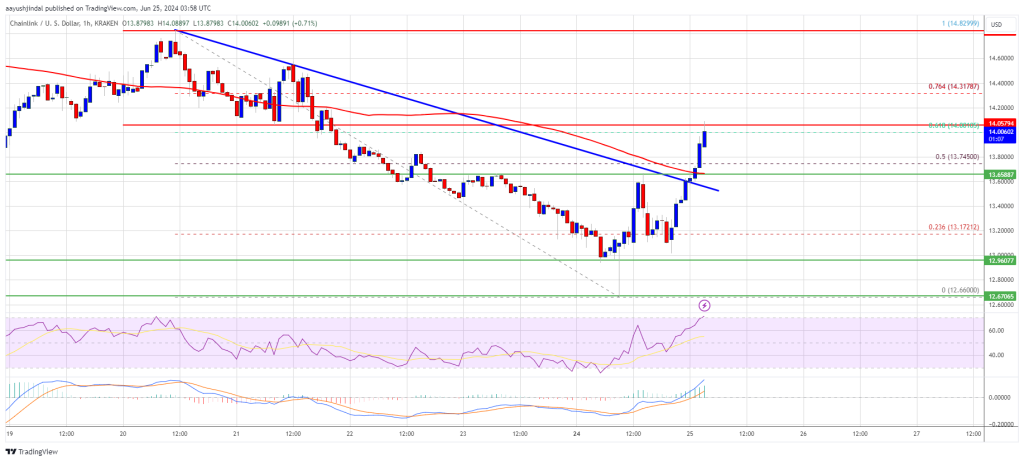
The next major resistance is near the $14.20 zone. A clear break above $14.20 may possibly start a steady increase toward the $14.50 level. The next major resistance is near the $14.80 level, above which the price could test $15.00. Any more gains might send the price toward the $15.50 resistance level in the coming sessions.
Are Dips Limited In LINK?
If Chainlink’s price fails to climb above the $14.20 resistance level, there could be a downside correction. Initial support on the downside is near the $13.80 level.
The next major support is near the $13.65 level or the 100-hourly simple moving average, below which the price might test the $13.50 level. Any more losses could lead LINK toward the $12.90 level in the near term.
Technical Indicators
Hourly MACD – The MACD for LINK/USD is gaining momentum in the bullish zone.
Hourly RSI (Relative Strength Index) – The RSI for LINK/USD is now above the 50 level.
Major Support Levels – $13.80 and $13.50.
Major Resistance Levels – $14.20 and $14.50.
What's Your Reaction?