Chainlink’s Ambitious Climb: LINK Price Aims for Key Upside Break
Chainlink’s LINK price is consolidating above the $14.00 support. The price could gain bullish momentum if it clears the $14.65 resistance zone. Chainlink price is showing bullish signs and eyeing more gains above $15.00 against the US dollar. The price is trading below the $15.00 level and the 100-hourly simple moving average. There is a key contracting triangle forming with resistance near $14.40 on the hourly chart of the LINK/USD pair (data source from Kraken). The price could start another increase if it clears the $14.65 resistance zone. Chainlink Price Eyes Additional Upsides In the past few sessions, Chainlink saw a decent upward move from the $13.00 zone. There was a move above the $13.50 and $14.00 levels. LINK bulls were in action unlike Bitcoin. However, the price seems to be facing hurdles near the $14.50 and $14.65 levels. A high was formed at $14.63 and the price is now consolidating gains. It is trading above the 23.6% Fib retracement level of the upward move from the $13.16 swing low to the $14.46 high. Chainlink is now trading below the $15.00 level and the 100-hourly simple moving average. There is also a key contracting triangle forming with resistance near $14.40 on the hourly chart of the LINK/USD pair. Immediate resistance is near the $14.40 level or the triangle zone. The next major resistance is near the $14.65 zone. A clear break above $14.65 may possibly start a steady increase toward the $15.00 level. The next major resistance is near the $15.20 level, above which the price could test $15.85. Another Decline In LINK? If Chainlink’s price fails to climb above the $14.40 resistance level, there could be a fresh decline. Initial support on the downside is near the $14.00 level or the triangle trend line. The next major support is near the $13.80 level or the 50% Fib retracement level of the upward move from the $13.16 swing low to the $14.46 high, below which the price might test the $13.50 level. Any more losses could lead LINK toward the $13.15 level in the near term. Technical Indicators Hourly MACD – The MACD for LINK/USD is losing momentum in the bullish zone. Hourly RSI (Relative Strength Index) – The RSI for LINK/USD is now above the 50 level. Major Support Levels – $14.00 and $13.80. Major Resistance Levels – $14.40 and $14.65.

Chainlink’s LINK price is consolidating above the $14.00 support. The price could gain bullish momentum if it clears the $14.65 resistance zone.
- Chainlink price is showing bullish signs and eyeing more gains above $15.00 against the US dollar.
- The price is trading below the $15.00 level and the 100-hourly simple moving average.
- There is a key contracting triangle forming with resistance near $14.40 on the hourly chart of the LINK/USD pair (data source from Kraken).
- The price could start another increase if it clears the $14.65 resistance zone.
Chainlink Price Eyes Additional Upsides
In the past few sessions, Chainlink saw a decent upward move from the $13.00 zone. There was a move above the $13.50 and $14.00 levels. LINK bulls were in action unlike Bitcoin.
However, the price seems to be facing hurdles near the $14.50 and $14.65 levels. A high was formed at $14.63 and the price is now consolidating gains. It is trading above the 23.6% Fib retracement level of the upward move from the $13.16 swing low to the $14.46 high.
Chainlink is now trading below the $15.00 level and the 100-hourly simple moving average. There is also a key contracting triangle forming with resistance near $14.40 on the hourly chart of the LINK/USD pair.
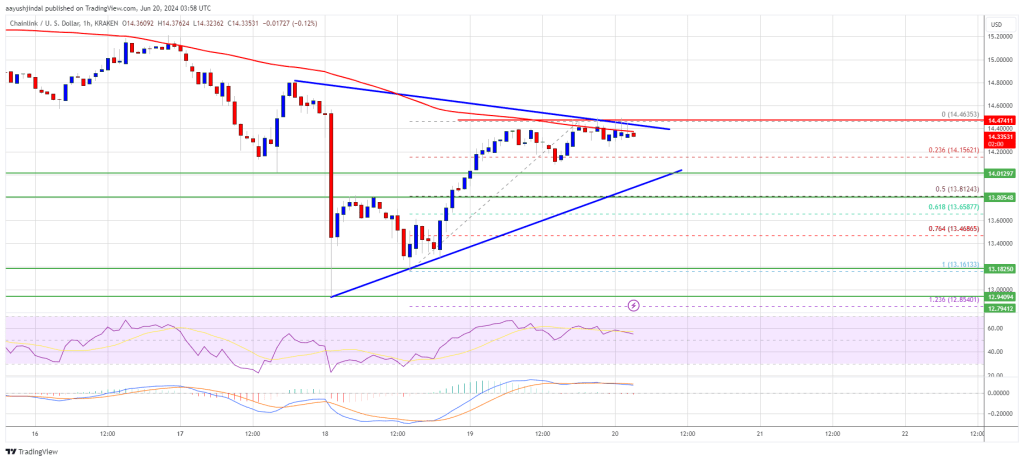
Immediate resistance is near the $14.40 level or the triangle zone. The next major resistance is near the $14.65 zone. A clear break above $14.65 may possibly start a steady increase toward the $15.00 level. The next major resistance is near the $15.20 level, above which the price could test $15.85.
Another Decline In LINK?
If Chainlink’s price fails to climb above the $14.40 resistance level, there could be a fresh decline. Initial support on the downside is near the $14.00 level or the triangle trend line.
The next major support is near the $13.80 level or the 50% Fib retracement level of the upward move from the $13.16 swing low to the $14.46 high, below which the price might test the $13.50 level. Any more losses could lead LINK toward the $13.15 level in the near term.
Technical Indicators
Hourly MACD – The MACD for LINK/USD is losing momentum in the bullish zone.
Hourly RSI (Relative Strength Index) – The RSI for LINK/USD is now above the 50 level.
Major Support Levels – $14.00 and $13.80.
Major Resistance Levels – $14.40 and $14.65.
What's Your Reaction?