


Dogecoin Bears Return: Indicators Point To More Losses In DOGE
Dogecoin started another decline from the $0.1285 resistance zone against the US Dollar. DOGE is consolidating and might resume its decline below $0.1220. DOGE price is moving lower below the $0.1250 support zone. The price is trading below the $0.1250 level and the 100-hourly simple moving average. There is a key rising channel or a bearish flag pattern forming with support near $0.1220 on the hourly chart of the DOGE/USD pair (data source from Kraken). The price must settle above $0.1260 and $0.1285 to gain bullish momentum and start a fresh increase. Dogecoin Price Dips Again After a decent recovery wave, Dogecoin price faced resistance near the $0.1285 zone. DOGE failed to continue higher and started a fresh decline from the $0.1285 high like Bitcoin and Ethereum. There was a move below the $0.1250 support level and the 100-hourly simple moving average. The price dipped below the 23.6% Fib retracement level of the upward move from the $0.1129 swing low to the $0.1285 high. However, the bulls are now active near the $0.1220 zone. Dogecoin is now trading below the $0.1250 level and the 100-hourly simple moving average. There is also a key rising channel or a bearish flag pattern forming with support near $0.1220 on the hourly chart of the DOGE/USD pair. If there is a fresh increase, the price might face resistance near the $0.1260 level. The next major resistance is near the $0.1285 level. A close above the $0.1285 resistance might send the price toward the $0.1350 resistance. Any more gains might send the price toward the $0.1420 level. The next major stop for the bulls might be $0.150. More Losses In DOGE? If DOGE’s price fails to gain pace above the $0.1285 level, it could continue to move down. Initial support on the downside is near the $0.1220 level. The next major support is near the $0.1185 level. If there is a downside break below the $0.1185 support, the price could decline further. In the stated case, the price might decline toward the $0.1120 level. Technical Indicators Hourly MACD – The MACD for DOGE/USD is now gaining momentum in the bearish zone. Hourly RSI (Relative Strength Index) – The RSI for DOGE/USD is now below the 50 level. Major Support Levels – $0.1220, $0.1185 and $0.1120. Major Resistance Levels – $0.1260, $0.1285, and $0.1320.

Dogecoin started another decline from the $0.1285 resistance zone against the US Dollar. DOGE is consolidating and might resume its decline below $0.1220.
- DOGE price is moving lower below the $0.1250 support zone.
- The price is trading below the $0.1250 level and the 100-hourly simple moving average.
- There is a key rising channel or a bearish flag pattern forming with support near $0.1220 on the hourly chart of the DOGE/USD pair (data source from Kraken).
- The price must settle above $0.1260 and $0.1285 to gain bullish momentum and start a fresh increase.
Dogecoin Price Dips Again
After a decent recovery wave, Dogecoin price faced resistance near the $0.1285 zone. DOGE failed to continue higher and started a fresh decline from the $0.1285 high like Bitcoin and Ethereum.
There was a move below the $0.1250 support level and the 100-hourly simple moving average. The price dipped below the 23.6% Fib retracement level of the upward move from the $0.1129 swing low to the $0.1285 high. However, the bulls are now active near the $0.1220 zone.
Dogecoin is now trading below the $0.1250 level and the 100-hourly simple moving average. There is also a key rising channel or a bearish flag pattern forming with support near $0.1220 on the hourly chart of the DOGE/USD pair.
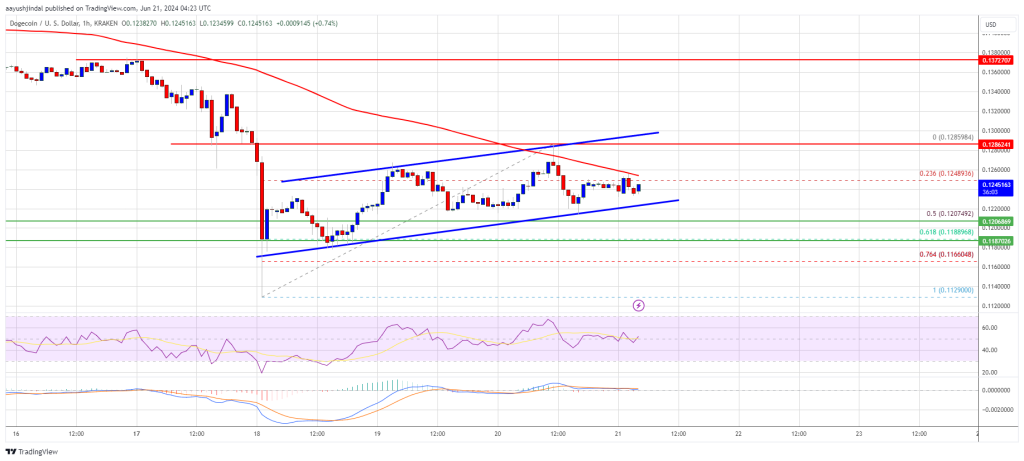
If there is a fresh increase, the price might face resistance near the $0.1260 level. The next major resistance is near the $0.1285 level. A close above the $0.1285 resistance might send the price toward the $0.1350 resistance. Any more gains might send the price toward the $0.1420 level. The next major stop for the bulls might be $0.150.
More Losses In DOGE?
If DOGE’s price fails to gain pace above the $0.1285 level, it could continue to move down. Initial support on the downside is near the $0.1220 level.
The next major support is near the $0.1185 level. If there is a downside break below the $0.1185 support, the price could decline further. In the stated case, the price might decline toward the $0.1120 level.
Technical Indicators
Hourly MACD – The MACD for DOGE/USD is now gaining momentum in the bearish zone.
Hourly RSI (Relative Strength Index) – The RSI for DOGE/USD is now below the 50 level.
Major Support Levels – $0.1220, $0.1185 and $0.1120.
Major Resistance Levels – $0.1260, $0.1285, and $0.1320.
What's Your Reaction?