

Dogecoin Price (DOGE) Bulls Target $0.15 Breakout: Can They Succeed?
Dogecoin started a steady increase above the $0.1320 resistance zone against the US Dollar. DOGE is consolidating and might extend its gains above $0.150. DOGE price is eyeing more gains above the $0.150 resistance zone. The price is trading above the $0.1320 level and the 100-hourly simple moving average. There is a key bullish trend line forming with support at $0.1345 on the hourly chart of the DOGE/USD pair (data source from Kraken). The price could continue to move up if it clears the $0.1420 resistance zone. Dogecoin Price Regains Strength, More Upsides Ahead? In the past few days, Dogecoin price saw a decent increase above the $0.1150 level. DOGE cleared the $0.1250 resistance to move into a positive zone like Bitcoin and Ethereum. The price even climbed above the $0.1320 level and the 100-hourly simple moving average. A high was formed at $0.1437 and the price is now consolidating gains. There was a minor decline below the $0.140 level. The price dipped below the 23.6% Fib retracement level of the upward move from the $0.1260 swing low to the $0.1437 high. Dogecoin is now trading above the $0.1320 level and the 100-hourly simple moving average. There is also a key bullish trend line forming with support at $0.1345 on the hourly chart of the DOGE/USD pair. The trend line is close to the 50% Fib retracement level of the upward move from the $0.1260 swing low to the $0.1437 high. If there is a fresh increase, the price might face resistance near the $0.1420 level. The next major resistance is near the $0.1450 level. A close above the $0.1450 resistance might send the price toward the $0.150 resistance. Any more gains might send the price toward the $0.1650 level. The next major stop for the bulls might be $0.1720. Are Dips Supported In DOGE? If DOGE’s price fails to gain pace above the $0.1420 level, it could start a downside correction. Initial support on the downside is near the $0.1365 level. The next major support is near the $0.1320 level. The main support sits at $0.1280. If there is a downside break below the $0.1280 support, the price could decline further. In the stated case, the price might decline toward the $0.1150 level. Technical Indicators Hourly MACD – The MACD for DOGE/USD is now gaining momentum in the bullish zone. Hourly RSI (Relative Strength Index) – The RSI for DOGE/USD is now above the 50 level. Major Support Levels – $0.1365 and $0.1320. Major Resistance Levels – $0.1420 and $0.1500.

Dogecoin started a steady increase above the $0.1320 resistance zone against the US Dollar. DOGE is consolidating and might extend its gains above $0.150.
- DOGE price is eyeing more gains above the $0.150 resistance zone.
- The price is trading above the $0.1320 level and the 100-hourly simple moving average.
- There is a key bullish trend line forming with support at $0.1345 on the hourly chart of the DOGE/USD pair (data source from Kraken).
- The price could continue to move up if it clears the $0.1420 resistance zone.
Dogecoin Price Regains Strength, More Upsides Ahead?
In the past few days, Dogecoin price saw a decent increase above the $0.1150 level. DOGE cleared the $0.1250 resistance to move into a positive zone like Bitcoin and Ethereum. The price even climbed above the $0.1320 level and the 100-hourly simple moving average.
A high was formed at $0.1437 and the price is now consolidating gains. There was a minor decline below the $0.140 level. The price dipped below the 23.6% Fib retracement level of the upward move from the $0.1260 swing low to the $0.1437 high.
Dogecoin is now trading above the $0.1320 level and the 100-hourly simple moving average. There is also a key bullish trend line forming with support at $0.1345 on the hourly chart of the DOGE/USD pair. The trend line is close to the 50% Fib retracement level of the upward move from the $0.1260 swing low to the $0.1437 high.
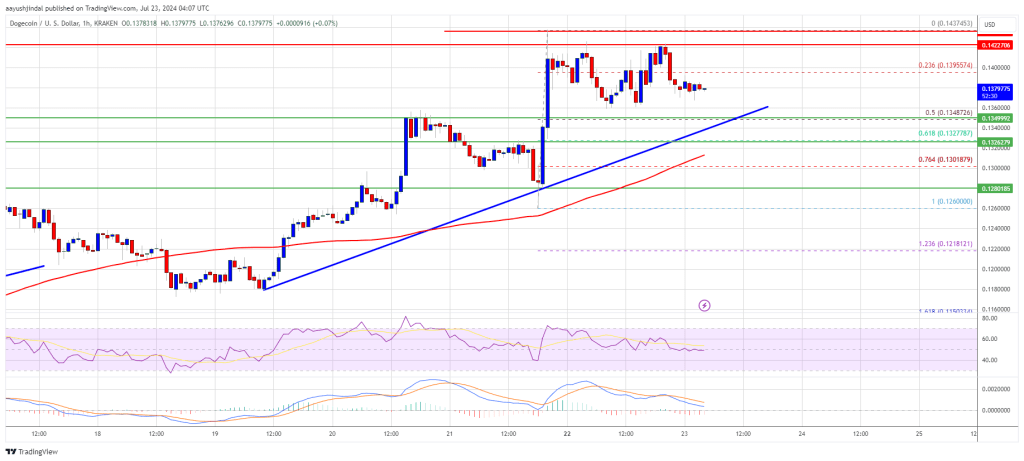
If there is a fresh increase, the price might face resistance near the $0.1420 level. The next major resistance is near the $0.1450 level. A close above the $0.1450 resistance might send the price toward the $0.150 resistance. Any more gains might send the price toward the $0.1650 level. The next major stop for the bulls might be $0.1720.
Are Dips Supported In DOGE?
If DOGE’s price fails to gain pace above the $0.1420 level, it could start a downside correction. Initial support on the downside is near the $0.1365 level. The next major support is near the $0.1320 level.
The main support sits at $0.1280. If there is a downside break below the $0.1280 support, the price could decline further. In the stated case, the price might decline toward the $0.1150 level.
Technical Indicators
Hourly MACD – The MACD for DOGE/USD is now gaining momentum in the bullish zone.
Hourly RSI (Relative Strength Index) – The RSI for DOGE/USD is now above the 50 level.
Major Support Levels – $0.1365 and $0.1320.
Major Resistance Levels – $0.1420 and $0.1500.
What's Your Reaction?