


Dogecoin Price (DOGE) Slips Into the Red: Key Hurdles to Watch
Dogecoin started a fresh decline from well above $0.1100 against the US Dollar. DOGE is down over 10% and struggling to start a recovery wave. DOGE price started a fresh decline and traded below $0.100. The price is trading below the $0.1050 level and the 100-hourly simple moving average. There is a key bearish trend line forming with resistance at $0.1025 on the hourly chart of the DOGE/USD pair (data source from Kraken). The price could start a recovery wave if it clears the $0.100 and $0.1025 levels. Dogecoin Price Faces Hurdles In the past few sessions, Dogecoin price saw a fresh decline below the $0.1050 level like Bitcoin and Ethereum. The price traded below the $0.100 level to enter a short-term bearish zone. There was a spike below the $0.0980 level. A low was formed at $0.0962 and the price is now attempting a recovery wave. There was a minor increase above the $0.0988 level. The price climbed above the 23.6% Fib retracement level of the downward move from the $0.1064 swing high to the $0.0962 low. Dogecoin price is now trading below the $0.1050 level and the 100-hourly simple moving average. Immediate resistance on the upside is near the $0.1012 level. The next major resistance is near the $0.1025 level. There is also a key bearish trend line forming with resistance at $0.1025 on the hourly chart of the DOGE/USD pair. The trend line is close to the 50% Fib retracement level of the downward move from the $0.1064 swing high to the $0.0962 low. A close above the $0.1025 resistance might send the price toward the $0.1088 resistance. Any more gains might send the price toward the $0.1120 level. The next major stop for the bulls might be $0.1250. More Downsides In DOGE? If DOGE’s price fails to climb above the $0.1025 level, it could start another decline. Initial support on the downside is near the $0.0962 level. The next major support is near the $0.095 level. The main support sits at $0.0920. If there is a downside break below the $0.0920 support, the price could decline further. In the stated case, the price might decline toward the $0.0880 level or even $0.0850 in the near term. Technical Indicators Hourly MACD – The MACD for DOGE/USD is now losing momentum in the bearish zone. Hourly RSI (Relative Strength Index) – The RSI for DOGE/USD is now below the 50 level. Major Support Levels – $0.0962 and $0.0920. Major Resistance Levels – $0.1025 and $0.1088.

Dogecoin started a fresh decline from well above $0.1100 against the US Dollar. DOGE is down over 10% and struggling to start a recovery wave.
- DOGE price started a fresh decline and traded below $0.100.
- The price is trading below the $0.1050 level and the 100-hourly simple moving average.
- There is a key bearish trend line forming with resistance at $0.1025 on the hourly chart of the DOGE/USD pair (data source from Kraken).
- The price could start a recovery wave if it clears the $0.100 and $0.1025 levels.
Dogecoin Price Faces Hurdles
In the past few sessions, Dogecoin price saw a fresh decline below the $0.1050 level like Bitcoin and Ethereum. The price traded below the $0.100 level to enter a short-term bearish zone.
There was a spike below the $0.0980 level. A low was formed at $0.0962 and the price is now attempting a recovery wave. There was a minor increase above the $0.0988 level. The price climbed above the 23.6% Fib retracement level of the downward move from the $0.1064 swing high to the $0.0962 low.
Dogecoin price is now trading below the $0.1050 level and the 100-hourly simple moving average. Immediate resistance on the upside is near the $0.1012 level. The next major resistance is near the $0.1025 level.
There is also a key bearish trend line forming with resistance at $0.1025 on the hourly chart of the DOGE/USD pair. The trend line is close to the 50% Fib retracement level of the downward move from the $0.1064 swing high to the $0.0962 low.
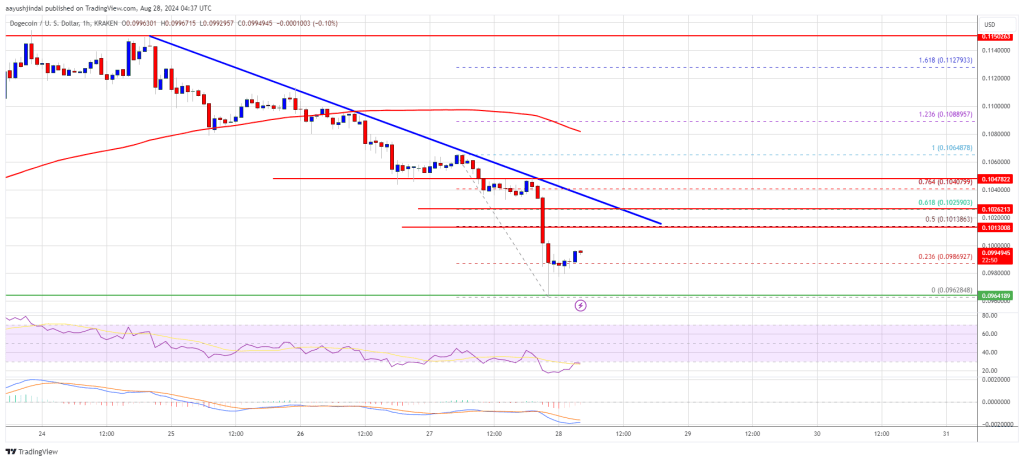
A close above the $0.1025 resistance might send the price toward the $0.1088 resistance. Any more gains might send the price toward the $0.1120 level. The next major stop for the bulls might be $0.1250.
More Downsides In DOGE?
If DOGE’s price fails to climb above the $0.1025 level, it could start another decline. Initial support on the downside is near the $0.0962 level. The next major support is near the $0.095 level.
The main support sits at $0.0920. If there is a downside break below the $0.0920 support, the price could decline further. In the stated case, the price might decline toward the $0.0880 level or even $0.0850 in the near term.
Technical Indicators
Hourly MACD – The MACD for DOGE/USD is now losing momentum in the bearish zone.
Hourly RSI (Relative Strength Index) – The RSI for DOGE/USD is now below the 50 level.
Major Support Levels – $0.0962 and $0.0920.
Major Resistance Levels – $0.1025 and $0.1088.
What's Your Reaction?