


Ethereum On The Rise and Outperforms Bitcoin: Signals Indicate Fresh Increase
Ethereum price started a fresh increase from the $3,365 zone. ETH outperformed Bitcoin and might aim for a move toward the $3,800 resistance zone. Ethereum started a recovery after the bulls appeared near the $3,365 zone. The price is trading above $3,550 and the 100-hourly Simple Moving Average. There was a break above a key bearish trend line with resistance near $3,550 on the hourly chart of ETH/USD (data feed via Kraken). The pair could extend gains if it stays above the $3,550 pivot level. Ethereum Price Outperforms Bitcoin Ethereum price extended losses below $3,550 and $3,500 resistance levels. However, ETH bulls took a strong stand near the $3,350 zone. A low was formed at $3,364 level and the price started a fresh increase, outperforming Bitcoin. There was a move above the $3,450 and $3,550 resistance levels. There was a break above a key bearish trend line with resistance near $3,550 on the hourly chart of ETH/USD. The pair even climbed above the $3,600 level and tested the $3,650 resistance. A high was formed at $3,649 before there was a pullback below $3,620. The price declined below the $3,600 support level and the 23.6% Fib retracement level of the upward move from the $3,364 swing low to the $3,649 high. Ethereum is now trading above $3,550 and the 100-hourly Simple Moving Average. If there is a fresh increase, the price might face resistance near the $3,620 level. The first major resistance is near the $3,650 level. An upside break above the $3,650 resistance might send the price higher. The next key resistance sits at $3,720, above which the price might gain traction and rise toward the $3,800 level. A clear move above the $3,800 level might send Ether toward the $3,880 resistance. Any more gains could send Ether toward the $3,950 resistance zone. Are Dips Limited In ETH? If Ethereum fails to clear the $3,620 resistance, it could continue to move down. Initial support on the downside is near $3,550. The first major support is at $3,500 and the 50% Fib retracement level of the upward move from the $3,364 swing low to the $3,649 high. A clear move below the $3,500 support might push the price toward $3,420. Any more losses might send the price toward the $3,365 level in the near term. Technical Indicators Hourly MACD – The MACD for ETH/USD is losing momentum in the bullish zone. Hourly RSI – The RSI for ETH/USD is now near the 50 zone. Major Support Level – $3,550 Major Resistance Level – $3,650

Ethereum price started a fresh increase from the $3,365 zone. ETH outperformed Bitcoin and might aim for a move toward the $3,800 resistance zone.
- Ethereum started a recovery after the bulls appeared near the $3,365 zone.
- The price is trading above $3,550 and the 100-hourly Simple Moving Average.
- There was a break above a key bearish trend line with resistance near $3,550 on the hourly chart of ETH/USD (data feed via Kraken).
- The pair could extend gains if it stays above the $3,550 pivot level.
Ethereum Price Outperforms Bitcoin
Ethereum price extended losses below $3,550 and $3,500 resistance levels. However, ETH bulls took a strong stand near the $3,350 zone. A low was formed at $3,364 level and the price started a fresh increase, outperforming Bitcoin.
There was a move above the $3,450 and $3,550 resistance levels. There was a break above a key bearish trend line with resistance near $3,550 on the hourly chart of ETH/USD. The pair even climbed above the $3,600 level and tested the $3,650 resistance.
A high was formed at $3,649 before there was a pullback below $3,620. The price declined below the $3,600 support level and the 23.6% Fib retracement level of the upward move from the $3,364 swing low to the $3,649 high.
Ethereum is now trading above $3,550 and the 100-hourly Simple Moving Average. If there is a fresh increase, the price might face resistance near the $3,620 level.
The first major resistance is near the $3,650 level. An upside break above the $3,650 resistance might send the price higher. The next key resistance sits at $3,720, above which the price might gain traction and rise toward the $3,800 level.
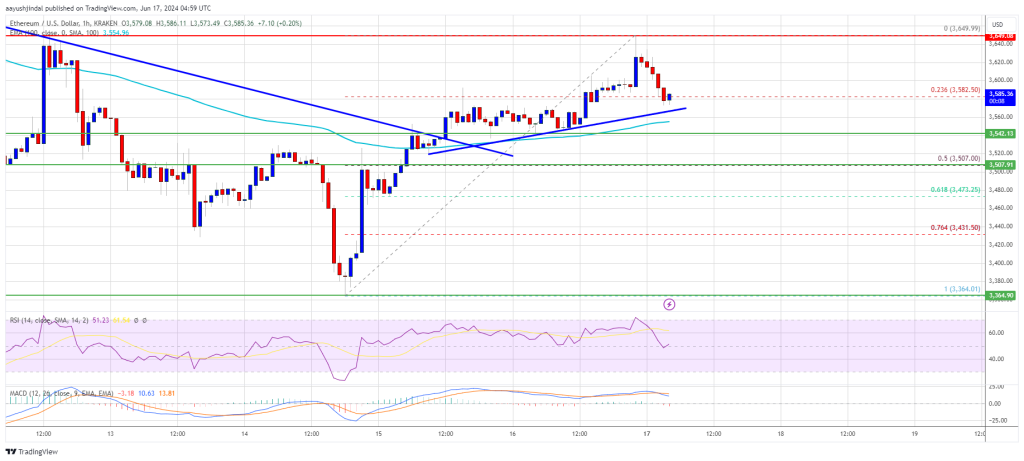
A clear move above the $3,800 level might send Ether toward the $3,880 resistance. Any more gains could send Ether toward the $3,950 resistance zone.
Are Dips Limited In ETH?
If Ethereum fails to clear the $3,620 resistance, it could continue to move down. Initial support on the downside is near $3,550. The first major support is at $3,500 and the 50% Fib retracement level of the upward move from the $3,364 swing low to the $3,649 high.
A clear move below the $3,500 support might push the price toward $3,420. Any more losses might send the price toward the $3,365 level in the near term.
Technical Indicators
Hourly MACD – The MACD for ETH/USD is losing momentum in the bullish zone.
Hourly RSI – The RSI for ETH/USD is now near the 50 zone.
Major Support Level – $3,550
Major Resistance Level – $3,650
What's Your Reaction?