


Ethereum Outperforms Bitcoin: Jumps Amid Market Divergence
Ethereum price started a fresh increase from the $3,350 support zone. ETH is outperforming Bitcoin and might rise further toward the $3,650 resistance. Ethereum is gaining pace from the key $3,365 support zone. The price is trading above $3,450 and the 100-hourly Simple Moving Average. There was a break above a key bearish trend line with resistance near $3,460 on the hourly chart of ETH/USD (data feed via Kraken). The pair formed a double-bottom pattern and gained pace above the $3,500 resistance. Ethereum Price Holds Key Support Ethereum price remained well-bid above the $3,350 support zone. ETH formed a base and started a fresh increase after it formed a double-bottom pattern near $3,350, as discussed yesterday. It outperformed Bitcoin and broke the $3,450 resistance. There was a clear move above the 50% Fib retracement level of the downward move from the $3,650 swing high to the $3,350 low. Besides, there was a break above a key bearish trend line with resistance near $3,460 on the hourly chart of ETH/USD. Ethereum is now trading above $3,450 and the 100-hourly Simple Moving Average. It is also showing positive signs for more gains above the $3,535 level. On the upside, the price might face resistance near the $3,580 level or the 76.4% Fib retracement level of the downward move from the $3,650 swing high to the $3,350 low. The first major resistance is near the $3,650 level. An upside break above the $3,650 resistance might send the price higher. The next key resistance sits at $3,720, above which the price might gain traction and rise toward the $3,750 level. A clear move above the $3,750 level might send Ether toward the $3,880 resistance. Any more gains could send Ether toward the $4,000 resistance zone in the coming days. Another Decline In ETH? If Ethereum fails to clear the $3,580 resistance, it could start another decline. Initial support on the downside is near $3,500. The first major support is $3,450. A clear move below the $3,450 support might push the price toward $3,350. Any more losses might send the price toward the $3,220 level in the near term. Technical Indicators Hourly MACD – The MACD for ETH/USD is gaining momentum in the bullish zone. Hourly RSI – The RSI for ETH/USD is now above the 50 zone. Major Support Level – $3,450 Major Resistance Level – $3,580

Ethereum price started a fresh increase from the $3,350 support zone. ETH is outperforming Bitcoin and might rise further toward the $3,650 resistance.
- Ethereum is gaining pace from the key $3,365 support zone.
- The price is trading above $3,450 and the 100-hourly Simple Moving Average.
- There was a break above a key bearish trend line with resistance near $3,460 on the hourly chart of ETH/USD (data feed via Kraken).
- The pair formed a double-bottom pattern and gained pace above the $3,500 resistance.
Ethereum Price Holds Key Support
Ethereum price remained well-bid above the $3,350 support zone. ETH formed a base and started a fresh increase after it formed a double-bottom pattern near $3,350, as discussed yesterday.
It outperformed Bitcoin and broke the $3,450 resistance. There was a clear move above the 50% Fib retracement level of the downward move from the $3,650 swing high to the $3,350 low. Besides, there was a break above a key bearish trend line with resistance near $3,460 on the hourly chart of ETH/USD.
Ethereum is now trading above $3,450 and the 100-hourly Simple Moving Average. It is also showing positive signs for more gains above the $3,535 level. On the upside, the price might face resistance near the $3,580 level or the 76.4% Fib retracement level of the downward move from the $3,650 swing high to the $3,350 low.
The first major resistance is near the $3,650 level. An upside break above the $3,650 resistance might send the price higher. The next key resistance sits at $3,720, above which the price might gain traction and rise toward the $3,750 level.
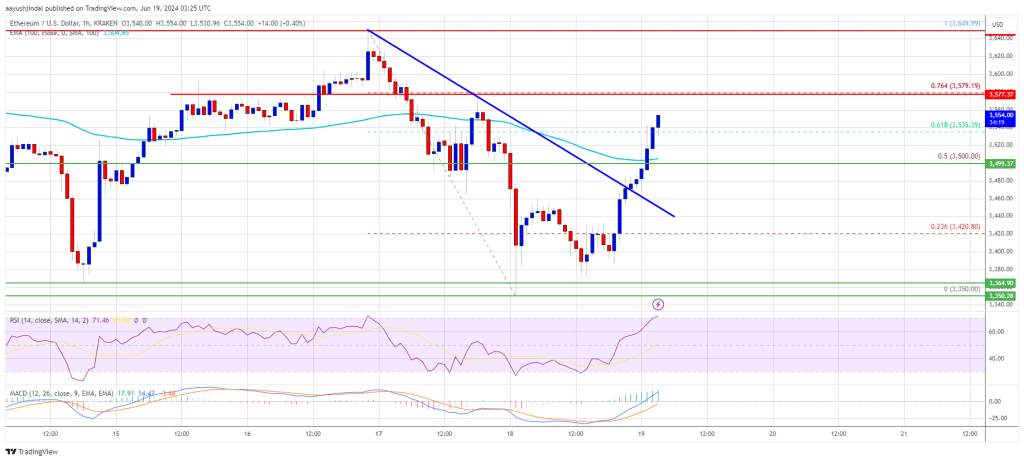
A clear move above the $3,750 level might send Ether toward the $3,880 resistance. Any more gains could send Ether toward the $4,000 resistance zone in the coming days.
Another Decline In ETH?
If Ethereum fails to clear the $3,580 resistance, it could start another decline. Initial support on the downside is near $3,500. The first major support is $3,450.
A clear move below the $3,450 support might push the price toward $3,350. Any more losses might send the price toward the $3,220 level in the near term.
Technical Indicators
Hourly MACD – The MACD for ETH/USD is gaining momentum in the bullish zone.
Hourly RSI – The RSI for ETH/USD is now above the 50 zone.
Major Support Level – $3,450
Major Resistance Level – $3,580
What's Your Reaction?


