


Ethereum Price Eyes Fresh Gains: Another Increase on the Horizon?
Ethereum price is consolidating above the $2,700 resistance. ETH could gain bullish momentum if it clears the $2,785 resistance zone. Ethereum is struggling to gain pace for a move above the $2,800 level. The price is trading above $2,700 and the 100-hourly Simple Moving Average. There is a key bullish trend line forming with support at $2,720 on the hourly chart of ETH/USD (data feed via Kraken). The pair could gain bullish momentum if there is a close above $2,780. Ethereum Price Starts Consolidation Ethereum price remained stable above the $2,650 level. ETH formed a base and started a steady upward move above the $2,720 level. There was a move toward the $2,820 level. A high was formed at $2,820 and the price is now correcting gains like Bitcoin. There was a minor pullback below the $2,780 level. The price declined below the 23.6% Fib retracement level of the upward move from the $2,536 swing low to the $2,820 high. Ethereum price is now trading above $2,720 and the 100-hourly Simple Moving Average. There is also a key bullish trend line forming with support at $2,720 on the hourly chart of ETH/USD. If there is another increase, the price might face hurdles near the $2,780 level. The first major resistance is near the $2,820 level. A close above the $2,820 level might send Ether toward the $2,880 resistance. The next key resistance is near $2,950. An upside break above the $2,950 resistance might send the price higher toward the $3,000 resistance zone in the near term. Another Decline In ETH? If Ethereum fails to clear the $2,780 resistance, it could start another decline. Initial support on the downside is near $2,720 and the trend line. The first major support sits near the $2,675 zone or the 50% Fib retracement level of the upward move from the $2,536 swing low to the $2,820 high. A clear move below the $2,675 support might push the price toward $2,620 where the bulls could emerge. Any more losses might send the price toward the $2,550 support level in the near term. The next key support sits at $2,500. Technical Indicators Hourly MACD – The MACD for ETH/USD is losing momentum in the bullish zone. Hourly RSI – The RSI for ETH/USD is now above the 50 zone. Major Support Level – $2,720 Major Resistance Level – $2,780

Ethereum price is consolidating above the $2,700 resistance. ETH could gain bullish momentum if it clears the $2,785 resistance zone.
- Ethereum is struggling to gain pace for a move above the $2,800 level.
- The price is trading above $2,700 and the 100-hourly Simple Moving Average.
- There is a key bullish trend line forming with support at $2,720 on the hourly chart of ETH/USD (data feed via Kraken).
- The pair could gain bullish momentum if there is a close above $2,780.
Ethereum Price Starts Consolidation
Ethereum price remained stable above the $2,650 level. ETH formed a base and started a steady upward move above the $2,720 level. There was a move toward the $2,820 level.
A high was formed at $2,820 and the price is now correcting gains like Bitcoin. There was a minor pullback below the $2,780 level. The price declined below the 23.6% Fib retracement level of the upward move from the $2,536 swing low to the $2,820 high.
Ethereum price is now trading above $2,720 and the 100-hourly Simple Moving Average. There is also a key bullish trend line forming with support at $2,720 on the hourly chart of ETH/USD.
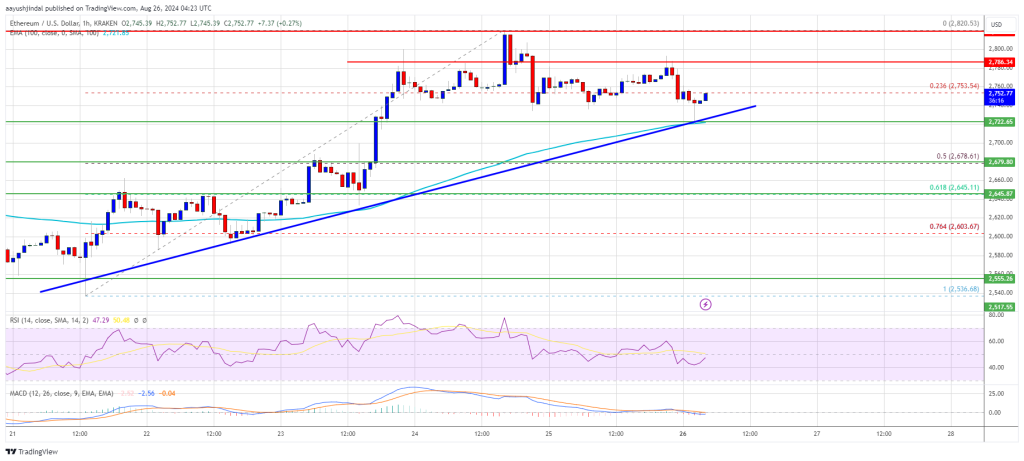
If there is another increase, the price might face hurdles near the $2,780 level. The first major resistance is near the $2,820 level. A close above the $2,820 level might send Ether toward the $2,880 resistance. The next key resistance is near $2,950. An upside break above the $2,950 resistance might send the price higher toward the $3,000 resistance zone in the near term.
Another Decline In ETH?
If Ethereum fails to clear the $2,780 resistance, it could start another decline. Initial support on the downside is near $2,720 and the trend line. The first major support sits near the $2,675 zone or the 50% Fib retracement level of the upward move from the $2,536 swing low to the $2,820 high.
A clear move below the $2,675 support might push the price toward $2,620 where the bulls could emerge. Any more losses might send the price toward the $2,550 support level in the near term. The next key support sits at $2,500.
Technical Indicators
Hourly MACD – The MACD for ETH/USD is losing momentum in the bullish zone.
Hourly RSI – The RSI for ETH/USD is now above the 50 zone.
Major Support Level – $2,720
Major Resistance Level – $2,780
What's Your Reaction?