


Ethereum Price Plummets: Potential Recovery Hindered by Bearish Pressure
Ethereum price failed to clear the $3,520 zone and started a fresh decline. ETH dived below the $3,250 support and even tested the $3,150 zone. Ethereum started a fresh decline below the $3,320 and $3,250 levels. The price is trading below $3,250 and the 100-hourly Simple Moving Average. There is a key bearish trend line forming with resistance near $3,325 on the hourly chart of ETH/USD (data feed via Kraken). The pair could correct losses, but upsides might be limited above the $3,320 zone. Ethereum Price Takes Hit Ethereum price failed to continue higher above the $3,450 and $3,420 resistance levels. ETH started another decline below the $3,320 support zone like Bitcoin. There was a move below the $3,250 and $3,220 support levels. The price declined 5% and even tested the $3,150 support. A low was formed at $3,156 and the price is now consolidating losses. There was a move above the $3,200 resistance level. The price is now testing the 23.6% Fib retracement level of the downward move from the $3,426 swing high to the $3,156 low. Ethereum is trading below $3,300 and the 100-hourly Simple Moving Average. If there is a recovery wave, the price might face resistance near the $3,250 level. The first major resistance is near the $3,300 level or the 50% Fib retracement level of the downward move from the $3,426 swing high to the $3,156 low. There is also a key bearish trend line forming with resistance near $3,325 on the hourly chart of ETH/USD. The next major hurdle is near the $3,365 level. A close above the $3,365 level might send Ether toward the $3,450 resistance. The next key resistance is near $3,500. An upside break above the $3,500 resistance might send the price higher. Any more gains could send Ether toward the $3,550 resistance zone. Another Decline In ETH? If Ethereum fails to clear the $3,320 resistance, it could continue to move down. Initial support on the downside is near $3,200. The first major support sits near the $3,150 zone. A clear move below the $3,150 support might push the price toward $3,080. Any more losses might send the price toward the $3,050 level in the near term. Technical Indicators Hourly MACD – The MACD for ETH/USD is gaining momentum in the bearish zone. Hourly RSI – The RSI for ETH/USD is now below the 50 zone. Major Support Level – $3,150 Major Resistance Level – $3,320

Ethereum price failed to clear the $3,520 zone and started a fresh decline. ETH dived below the $3,250 support and even tested the $3,150 zone.
- Ethereum started a fresh decline below the $3,320 and $3,250 levels.
- The price is trading below $3,250 and the 100-hourly Simple Moving Average.
- There is a key bearish trend line forming with resistance near $3,325 on the hourly chart of ETH/USD (data feed via Kraken).
- The pair could correct losses, but upsides might be limited above the $3,320 zone.
Ethereum Price Takes Hit
Ethereum price failed to continue higher above the $3,450 and $3,420 resistance levels. ETH started another decline below the $3,320 support zone like Bitcoin. There was a move below the $3,250 and $3,220 support levels.
The price declined 5% and even tested the $3,150 support. A low was formed at $3,156 and the price is now consolidating losses. There was a move above the $3,200 resistance level. The price is now testing the 23.6% Fib retracement level of the downward move from the $3,426 swing high to the $3,156 low.
Ethereum is trading below $3,300 and the 100-hourly Simple Moving Average. If there is a recovery wave, the price might face resistance near the $3,250 level. The first major resistance is near the $3,300 level or the 50% Fib retracement level of the downward move from the $3,426 swing high to the $3,156 low.
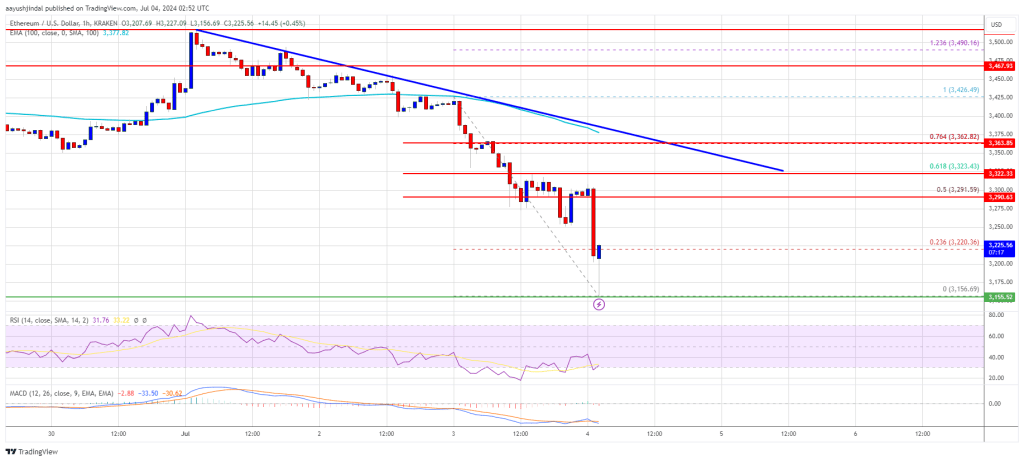
There is also a key bearish trend line forming with resistance near $3,325 on the hourly chart of ETH/USD. The next major hurdle is near the $3,365 level. A close above the $3,365 level might send Ether toward the $3,450 resistance. The next key resistance is near $3,500. An upside break above the $3,500 resistance might send the price higher. Any more gains could send Ether toward the $3,550 resistance zone.
Another Decline In ETH?
If Ethereum fails to clear the $3,320 resistance, it could continue to move down. Initial support on the downside is near $3,200. The first major support sits near the $3,150 zone.
A clear move below the $3,150 support might push the price toward $3,080. Any more losses might send the price toward the $3,050 level in the near term.
Technical Indicators
Hourly MACD – The MACD for ETH/USD is gaining momentum in the bearish zone.
Hourly RSI – The RSI for ETH/USD is now below the 50 zone.
Major Support Level – $3,150
Major Resistance Level – $3,320
What's Your Reaction?