
Ethereum Price Sets Sights on Upside Break: Indicators Turn Green
Ethereum price is moving higher above the $3,080 resistance zone. ETH could gain bullish momentum if there is a close above the $3,150 resistance. Ethereum is slowly moving higher above the $3,050 level. The price is trading above $3,050 and the 100-hourly Simple Moving Average. There was a break above a short-term bullish flag with resistance near $3,090 on the hourly chart of ETH/USD (data feed via Kraken). The pair could gain bullish momentum if there is a close above the $3,150 resistance zone. Ethereum Price Could Extend Gains Above $3,150 Ethereum price extended its recovery wave above the $3,000 resistance zone. ETH even climbed above the $3,050 resistance. There was a break above a short-term bullish flag with resistance near $3,090 on the hourly chart of ETH/USD. The pair even spiked above the $3,110 resistance, outperforming Bitcoin. It tested the $3,150 resistance zone. A high was formed at $3,149 and the price is now consolidating gains. There was a minor decline below $3,120. The price tested the 23.6% Fib retracement level of the upward move from the $2,895 swing low to the $3,149 high. Ethereum is now trading above $3,050 and the 100-hourly Simple Moving Average. On the upside, the price is facing resistance near the $3,120 level. The first major resistance is near the $3,150 level. The next major hurdle is near the $3,220 level. A close above the $3,220 level might send Ether toward the $3,320 resistance. The next key resistance is near $3,400. An upside break above the $3,400 resistance might send the price higher toward the $3,500 resistance zone in the coming days. Another Decline In ETH? If Ethereum fails to clear the $3,150 resistance, it could start another decline. Initial support on the downside is near $3,080. The first major support sits near the $3,020 zone and the 50% Fib retracement level of the upward move from the $2,895 swing low to the $3,149 high. A clear move below the $3,020 support might push the price toward $2,955. Any more losses might send the price toward the $2,880 support level in the near term. Technical Indicators Hourly MACD – The MACD for ETH/USD is losing momentum in the bullish zone. Hourly RSI – The RSI for ETH/USD is now above the 50 zone. Major Support Level – $3,020 Major Resistance Level – $3,150

Ethereum price is moving higher above the $3,080 resistance zone. ETH could gain bullish momentum if there is a close above the $3,150 resistance.
- Ethereum is slowly moving higher above the $3,050 level.
- The price is trading above $3,050 and the 100-hourly Simple Moving Average.
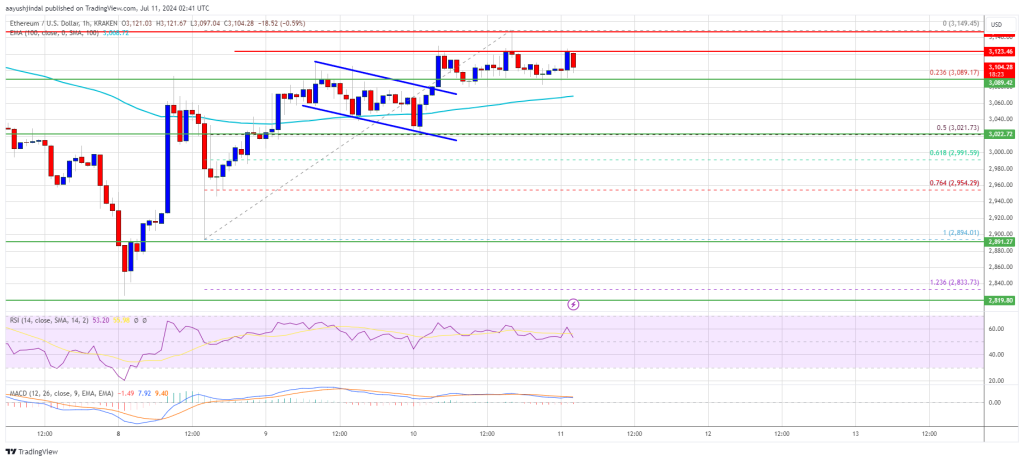
- There was a break above a short-term bullish flag with resistance near $3,090 on the hourly chart of ETH/USD (data feed via Kraken).
- The pair could gain bullish momentum if there is a close above the $3,150 resistance zone.
Ethereum Price Could Extend Gains Above $3,150
Ethereum price extended its recovery wave above the $3,000 resistance zone. ETH even climbed above the $3,050 resistance. There was a break above a short-term bullish flag with resistance near $3,090 on the hourly chart of ETH/USD.
The pair even spiked above the $3,110 resistance, outperforming Bitcoin. It tested the $3,150 resistance zone. A high was formed at $3,149 and the price is now consolidating gains. There was a minor decline below $3,120. The price tested the 23.6% Fib retracement level of the upward move from the $2,895 swing low to the $3,149 high.
Ethereum is now trading above $3,050 and the 100-hourly Simple Moving Average. On the upside, the price is facing resistance near the $3,120 level.
The first major resistance is near the $3,150 level. The next major hurdle is near the $3,220 level. A close above the $3,220 level might send Ether toward the $3,320 resistance. The next key resistance is near $3,400. An upside break above the $3,400 resistance might send the price higher toward the $3,500 resistance zone in the coming days.
Another Decline In ETH?
If Ethereum fails to clear the $3,150 resistance, it could start another decline. Initial support on the downside is near $3,080. The first major support sits near the $3,020 zone and the 50% Fib retracement level of the upward move from the $2,895 swing low to the $3,149 high.
A clear move below the $3,020 support might push the price toward $2,955. Any more losses might send the price toward the $2,880 support level in the near term.
Technical Indicators
Hourly MACD – The MACD for ETH/USD is losing momentum in the bullish zone.
Hourly RSI – The RSI for ETH/USD is now above the 50 zone.
Major Support Level – $3,020
Major Resistance Level – $3,150
What's Your Reaction?