


Ethereum Price Turns Lower: Can ETH Bounce Back From $2,550?
Ethereum price started a pullback from the $2,680 resistance. ETH is now declining and remains at risk of more downsides if it fails to stay above $2,550. Ethereum started a fresh decline below the $2,650 level. The price is trading below $2,680 and the 100-hourly Simple Moving Average. There is a key bullish trend line forming with support at $2,610 on the hourly chart of ETH/USD (data feed via Kraken). The pair could extend losses if it drops below the $2,550 support zone. Ethereum Price Shows Signs of Weakness Ethereum price attempted to gain pace for a move above the $2,680 level. However, ETH failed to continue higher and started a fresh decline below $2,650 like Bitcoin. There was a break below the 23.6% Fib retracement level of the upward move from the $2,514 swing low to the $2,682 high. The price even slipped below the 100-hourly Simple Moving Average. However, the bulls are now active near the $2,620 level. Ethereum price is now trading below $2,650 and the 100-hourly Simple Moving Average. There is also a key bullish trend line forming with support at $2,610 on the hourly chart of ETH/USD. If there is another increase, the price might face hurdles near the $2,650 level. The first major resistance is near the $2,680 level. A close above the $2,680 level might send Ether toward the $2,720 resistance. The next key resistance is near $2,720. An upside break above the $2,720 resistance might send the price higher toward the $2,880 resistance zone in the near term. More Losses In ETH? If Ethereum fails to clear the $2,680 resistance, it could continue to move down. Initial support on the downside is near $2,620. The first major support sits near the $2,600 zone or the 50% Fib retracement level of the upward move from the $2,514 swing low to the $2,682 high. A clear move below the $2,600 support might push the price toward $2,550 where the bulls could emerge. Any more losses might send the price toward the $2,500 support level in the near term. The next key support sits at $2,440. Technical Indicators Hourly MACD – The MACD for ETH/USD is gaining momentum in the bearish zone. Hourly RSI – The RSI for ETH/USD is now below the 50 zone. Major Support Level – $2,600 Major Resistance Level – $2,680

Ethereum price started a pullback from the $2,680 resistance. ETH is now declining and remains at risk of more downsides if it fails to stay above $2,550.
- Ethereum started a fresh decline below the $2,650 level.
- The price is trading below $2,680 and the 100-hourly Simple Moving Average.
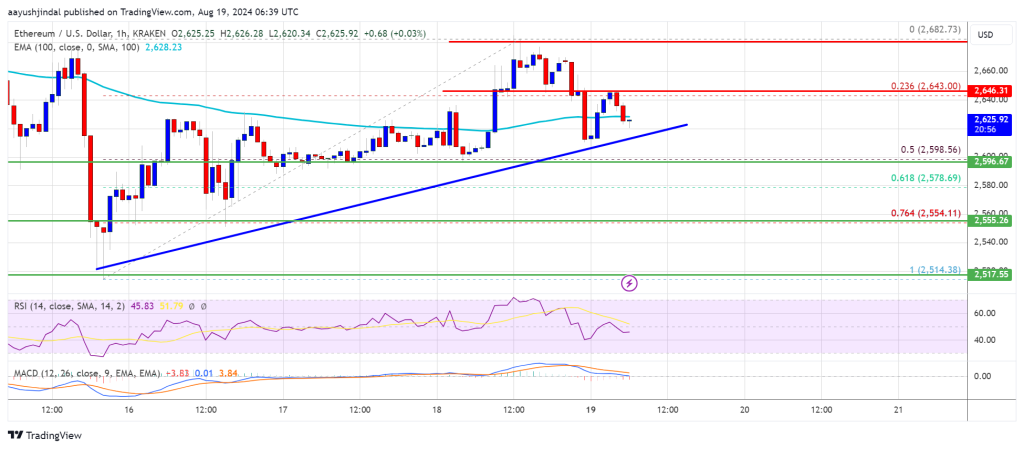
- There is a key bullish trend line forming with support at $2,610 on the hourly chart of ETH/USD (data feed via Kraken).
- The pair could extend losses if it drops below the $2,550 support zone.
Ethereum Price Shows Signs of Weakness
Ethereum price attempted to gain pace for a move above the $2,680 level. However, ETH failed to continue higher and started a fresh decline below $2,650 like Bitcoin.
There was a break below the 23.6% Fib retracement level of the upward move from the $2,514 swing low to the $2,682 high. The price even slipped below the 100-hourly Simple Moving Average. However, the bulls are now active near the $2,620 level.
Ethereum price is now trading below $2,650 and the 100-hourly Simple Moving Average. There is also a key bullish trend line forming with support at $2,610 on the hourly chart of ETH/USD.
If there is another increase, the price might face hurdles near the $2,650 level. The first major resistance is near the $2,680 level. A close above the $2,680 level might send Ether toward the $2,720 resistance. The next key resistance is near $2,720. An upside break above the $2,720 resistance might send the price higher toward the $2,880 resistance zone in the near term.
More Losses In ETH?
If Ethereum fails to clear the $2,680 resistance, it could continue to move down. Initial support on the downside is near $2,620. The first major support sits near the $2,600 zone or the 50% Fib retracement level of the upward move from the $2,514 swing low to the $2,682 high.
A clear move below the $2,600 support might push the price toward $2,550 where the bulls could emerge. Any more losses might send the price toward the $2,500 support level in the near term. The next key support sits at $2,440.
Technical Indicators
Hourly MACD – The MACD for ETH/USD is gaining momentum in the bearish zone.
Hourly RSI – The RSI for ETH/USD is now below the 50 zone.
Major Support Level – $2,600
Major Resistance Level – $2,680
What's Your Reaction?