


![Top Bitcoin Casinos – USA [August 2025]](https://static.news.bitcoin.com/wp-content/uploads/2025/08/bitcoin-casino-usa.png)
Ethereum Settles Below $3K: Bearish Sentiment Points to Deeper Decline
Ethereum price remained in a bearish zone below $3,150 zone. ETH is again moving lower and the bears could aim for a drop below $2,800. Ethereum started a fresh decline below the $3,000 and $2,950 levels. The price is trading below $3,000 and the 100-hourly Simple Moving Average. There is a key bearish trend line forming with resistance near $2,950 on the hourly chart of ETH/USD (data feed via Kraken). The pair could correct losses, but upsides might be limited above the $3,000 zone. Ethereum Price Remains At Risk of More Downsides Ethereum price failed to start a recovery wave above the $3,080 and $3,120 resistance levels. ETH started another decline below the $3,000 support zone like Bitcoin. There was a move below the $2,950 and $2,920 support levels. The price declined 6% and even tested the $2,820 support. A low was formed at $2,825 and the price is now consolidating losses. The price is showing a lot of bearish signs and testing the 23.6% Fib retracement level of the downward move from the $3,077 swing high to the $2,825 low. Ethereum is trading below $3,000 and the 100-hourly Simple Moving Average. If there is a recovery wave, the price might face resistance near the $2,920 level. The first major resistance is near the $2,950 level. There is also a key bearish trend line forming with resistance near $2,950 on the hourly chart of ETH/USD. The trend line is close to the 50% Fib retracement level of the downward move from the $3,077 swing high to the $2,825 low. The next major hurdle is near the $3,000 level. A close above the $3,000 level might send Ether toward the $3,080 resistance. The next key resistance is near $3,120. An upside break above the $3,120 resistance might send the price higher toward the $3,250 resistance zone. More Losses In ETH? If Ethereum fails to clear the $2,950 resistance, it could continue to move down. Initial support on the downside is near $2,820. The first major support sits near the $2,800 zone. A clear move below the $2,800 support might push the price toward $2,720. Any more losses might send the price toward the $2,650 level in the near term. Technical Indicators Hourly MACD – The MACD for ETH/USD is gaining momentum in the bearish zone. Hourly RSI – The RSI for ETH/USD is now below the 50 zone. Major Support Level – $2,820 Major Resistance Level – $2,950

Ethereum price remained in a bearish zone below $3,150 zone. ETH is again moving lower and the bears could aim for a drop below $2,800.
- Ethereum started a fresh decline below the $3,000 and $2,950 levels.
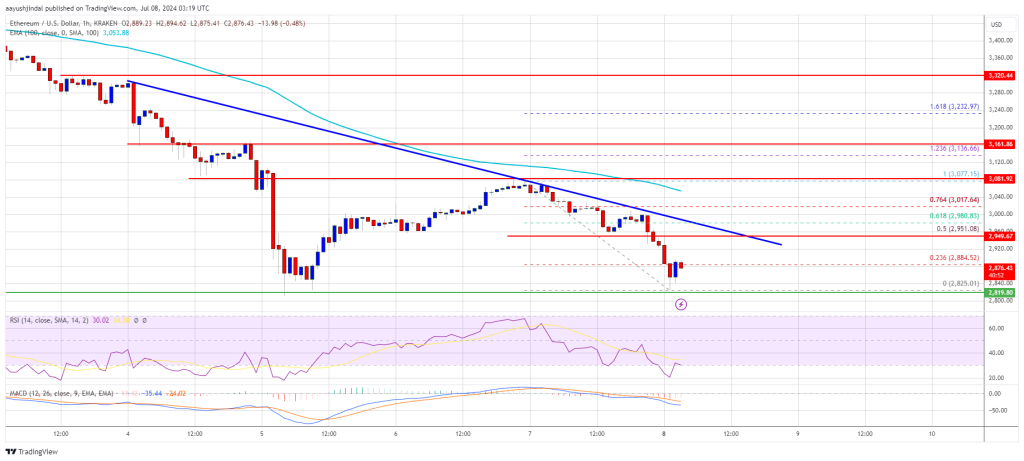
- The price is trading below $3,000 and the 100-hourly Simple Moving Average.
- There is a key bearish trend line forming with resistance near $2,950 on the hourly chart of ETH/USD (data feed via Kraken).
- The pair could correct losses, but upsides might be limited above the $3,000 zone.
Ethereum Price Remains At Risk of More Downsides
Ethereum price failed to start a recovery wave above the $3,080 and $3,120 resistance levels. ETH started another decline below the $3,000 support zone like Bitcoin. There was a move below the $2,950 and $2,920 support levels.
The price declined 6% and even tested the $2,820 support. A low was formed at $2,825 and the price is now consolidating losses. The price is showing a lot of bearish signs and testing the 23.6% Fib retracement level of the downward move from the $3,077 swing high to the $2,825 low.
Ethereum is trading below $3,000 and the 100-hourly Simple Moving Average. If there is a recovery wave, the price might face resistance near the $2,920 level. The first major resistance is near the $2,950 level.
There is also a key bearish trend line forming with resistance near $2,950 on the hourly chart of ETH/USD. The trend line is close to the 50% Fib retracement level of the downward move from the $3,077 swing high to the $2,825 low.
The next major hurdle is near the $3,000 level. A close above the $3,000 level might send Ether toward the $3,080 resistance. The next key resistance is near $3,120. An upside break above the $3,120 resistance might send the price higher toward the $3,250 resistance zone.
More Losses In ETH?
If Ethereum fails to clear the $2,950 resistance, it could continue to move down. Initial support on the downside is near $2,820. The first major support sits near the $2,800 zone.
A clear move below the $2,800 support might push the price toward $2,720. Any more losses might send the price toward the $2,650 level in the near term.
Technical Indicators
Hourly MACD – The MACD for ETH/USD is gaining momentum in the bearish zone.
Hourly RSI – The RSI for ETH/USD is now below the 50 zone.
Major Support Level – $2,820
Major Resistance Level – $2,950
What's Your Reaction?