


Polkadot (DOT) Bulls Push Toward $4.8 Resistance, Breakout Ahead?
Polkadot (DOT) has been gaining significant bullish momentum, with its price steadily approaching the critical resistance level of $4.8. This upward movement suggests a strong presence of positive sentiment in the market. As DOT nears this key resistance, speculations are about whether the bulls can maintain their dominance and drive the price higher. A successful breakout above $4.8 could signal the beginning of a new bullish phase, potentially leading to further gains. However, failure to break this level might result in a pullback. This article analyzes DOT’s recent price action and its approach to the critical $4.8 resistance level. With the help of technical indicators, it will evaluate the significance of this resistance, assess market sentiment, and predict potential future movements, including the likelihood of a breakout. DOT was trading at around $4.73 and has increased by over 3.58% with a market capitalization of over $6.9 billion and a trading volume of over $200 Million as of the time of writing. In the last 24 hours, the asset’s market cap has increased by more than 3.61%, while its trading volume has increased by more than 7.46% Market Sentiment: Are Bulls In Control? Currently, the price of DOT on the 4-hour chart has been on a bullish move following a rejection at the $3.5 support mark. It is now advancing toward the $4.8 resistance mark and the 100-day Simple Moving Average (SMA). Since breaching this key resistance level, the digital asset has shown a consistent upward trend, indicating that the bulls are gaining control and could drive the price even higher. Additionally, an analysis of the 4-hour Relative Strength Index (RSI) shows that the signal line of the indicator has successfully risen above 50% and is currently heading to 60%, suggesting that buying pressure is increasing and the asset might experience further upward movement. On the 1-day chart, although DOT is still trading below the 100-day SMA, it has successfully printed three bullish momentum candlesticks approaching the $4.8 resistance level. This indicates that the bulls remain in control, which could help trigger a rally for DOT. Finally, on the 1-day chart, the RSI signal line is ascending from the oversold zone toward 50%, further supporting the potential for a continued rally and indicating that the bulls are gaining control over the bears. Conclusion: Will DOT Break Through Or Face Rejection? In conclusion, as DOT’s price approaches the $4.8 resistance level, it could either break through or encounter a rejection. A breakthrough above the $4.8 resistance level, DOT might continue its bullish move to challenge the $6.2 resistance level. Once it breaks below this range, the digital asset may move further to test the $7.7 level and probably other key levels afterwards. Meanwhile, if DOT encounters rejection at the $4.8 resistance level, it may start to decline toward the $3.5 support level. Should the price fall below this support, it could drop more to test the $1.9 support point, potentially creating a new low if this level is breached. Featured image from Adobe Stock, chart from Tradingview.com

Polkadot (DOT) has been gaining significant bullish momentum, with its price steadily approaching the critical resistance level of $4.8. This upward movement suggests a strong presence of positive sentiment in the market. As DOT nears this key resistance, speculations are about whether the bulls can maintain their dominance and drive the price higher. A successful breakout above $4.8 could signal the beginning of a new bullish phase, potentially leading to further gains. However, failure to break this level might result in a pullback.
This article analyzes DOT’s recent price action and its approach to the critical $4.8 resistance level. With the help of technical indicators, it will evaluate the significance of this resistance, assess market sentiment, and predict potential future movements, including the likelihood of a breakout.
DOT was trading at around $4.73 and has increased by over 3.58% with a market capitalization of over $6.9 billion and a trading volume of over $200 Million as of the time of writing. In the last 24 hours, the asset’s market cap has increased by more than 3.61%, while its trading volume has increased by more than 7.46%
Market Sentiment: Are Bulls In Control?
Currently, the price of DOT on the 4-hour chart has been on a bullish move following a rejection at the $3.5 support mark. It is now advancing toward the $4.8 resistance mark and the 100-day Simple Moving Average (SMA). Since breaching this key resistance level, the digital asset has shown a consistent upward trend, indicating that the bulls are gaining control and could drive the price even higher.
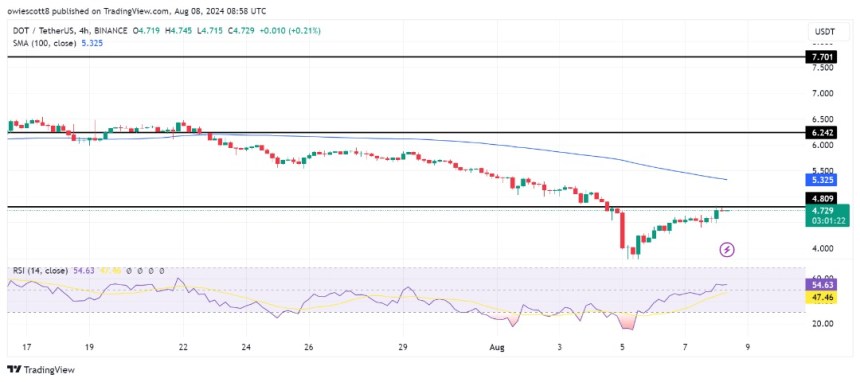
Additionally, an analysis of the 4-hour Relative Strength Index (RSI) shows that the signal line of the indicator has successfully risen above 50% and is currently heading to 60%, suggesting that buying pressure is increasing and the asset might experience further upward movement.
On the 1-day chart, although DOT is still trading below the 100-day SMA, it has successfully printed three bullish momentum candlesticks approaching the $4.8 resistance level. This indicates that the bulls remain in control, which could help trigger a rally for DOT.
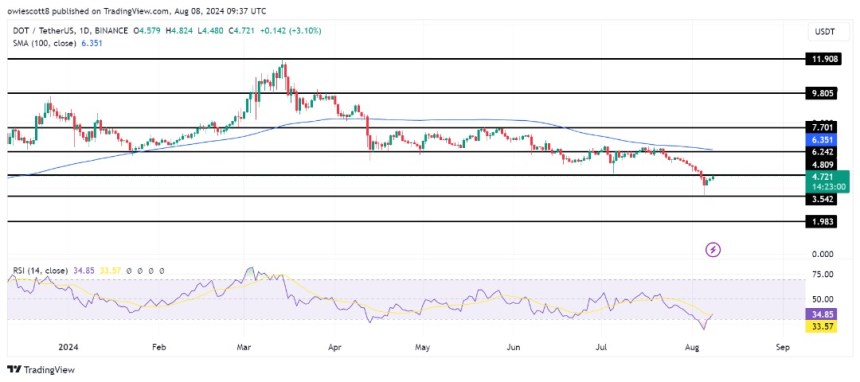
Finally, on the 1-day chart, the RSI signal line is ascending from the oversold zone toward 50%, further supporting the potential for a continued rally and indicating that the bulls are gaining control over the bears.
Conclusion: Will DOT Break Through Or Face Rejection?
In conclusion, as DOT’s price approaches the $4.8 resistance level, it could either break through or encounter a rejection.
A breakthrough above the $4.8 resistance level, DOT might continue its bullish move to challenge the $6.2 resistance level. Once it breaks below this range, the digital asset may move further to test the $7.7 level and probably other key levels afterwards.
Meanwhile, if DOT encounters rejection at the $4.8 resistance level, it may start to decline toward the $3.5 support level. Should the price fall below this support, it could drop more to test the $1.9 support point, potentially creating a new low if this level is breached.
What's Your Reaction?