


Ripple (XRP) Range-Bound Struggle: Will It Break Free?
XRP price is struggling to gain bullish momentum above $0.50. The price must settle above $0.50 and $0.520 to start a steady increase in the near term. XRP price extended losses before it found support near the $0.4765 zone. The price is now trading above $0.4850 and the 100-hourly Simple Moving Average. There is a key bearish trend line forming with resistance at $0.4980 on the hourly chart of the XRP/USD pair (data source from Kraken). The pair could start a decent increase if it settles above the $0.50 resistance zone. XRP Price Holds Support XRP price failed to start a fresh increase and again reacted to the downside like Bitcoin. There was a move below the $0.4800 level, but the bulls were active near the $0.4765 level. A low was formed at $0.4765 and the price is now correcting losses. There was a move above the $0.4850 and $0.4900 resistance levels. The bulls pushed the price above the 50% Fib retracement level of the downward move from the $0.5104 swing high to the $0.4765 low. It is now trading above $0.4850 and the 100-hourly Simple Moving Average. On the upside, the price is facing resistance near the $0.4980 level and the 61.8% Fib retracement level of the downward move from the $0.5104 swing high to the $0.4765 low. There is also a key bearish trend line forming with resistance at $0.4980 on the hourly chart of the XRP/USD pair. The first key resistance is near $0.500. The next major resistance is near the $0.5020 level. A close above the $0.5020 resistance zone could send the price higher. The next key resistance is near $0.5200. If there is a clear move above the $0.520 resistance level, there could be a steady increase toward the $0.5320 resistance. Any more gains might send the price toward the $0.5500 resistance. Another Drop? If XRP fails to clear the $0.4980 resistance zone, it could start another decline. Initial support on the downside is near the $0.490 level and the 100-hourly Simple Moving Average. The next major support is at $0.4850. If there is a downside break and a close below the $0.4850 level, the price might gain bearish momentum. In the stated case, the price could even trade below the $0.4765 low in the near term. Technical Indicators Hourly MACD – The MACD for XRP/USD is now losing pace in the bearish zone. Hourly RSI (Relative Strength Index) – The RSI for XRP/USD is now above the 50 level. Major Support Levels – $0.4850 and $0.4765. Major Resistance Levels – $0.4980 and $0.500.

XRP price is struggling to gain bullish momentum above $0.50. The price must settle above $0.50 and $0.520 to start a steady increase in the near term.
- XRP price extended losses before it found support near the $0.4765 zone.
- The price is now trading above $0.4850 and the 100-hourly Simple Moving Average.
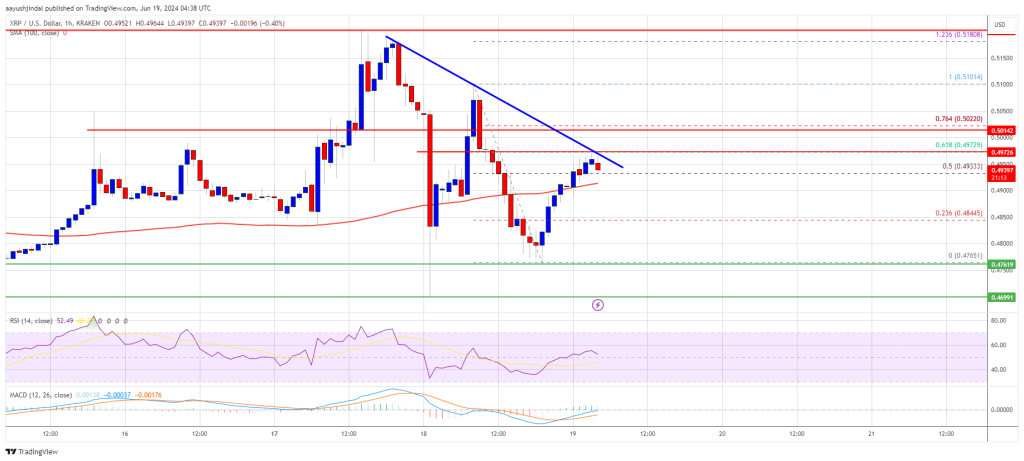
- There is a key bearish trend line forming with resistance at $0.4980 on the hourly chart of the XRP/USD pair (data source from Kraken).
- The pair could start a decent increase if it settles above the $0.50 resistance zone.
XRP Price Holds Support
XRP price failed to start a fresh increase and again reacted to the downside like Bitcoin. There was a move below the $0.4800 level, but the bulls were active near the $0.4765 level.
A low was formed at $0.4765 and the price is now correcting losses. There was a move above the $0.4850 and $0.4900 resistance levels. The bulls pushed the price above the 50% Fib retracement level of the downward move from the $0.5104 swing high to the $0.4765 low.
It is now trading above $0.4850 and the 100-hourly Simple Moving Average. On the upside, the price is facing resistance near the $0.4980 level and the 61.8% Fib retracement level of the downward move from the $0.5104 swing high to the $0.4765 low.
There is also a key bearish trend line forming with resistance at $0.4980 on the hourly chart of the XRP/USD pair. The first key resistance is near $0.500. The next major resistance is near the $0.5020 level.
A close above the $0.5020 resistance zone could send the price higher. The next key resistance is near $0.5200. If there is a clear move above the $0.520 resistance level, there could be a steady increase toward the $0.5320 resistance. Any more gains might send the price toward the $0.5500 resistance.
Another Drop?
If XRP fails to clear the $0.4980 resistance zone, it could start another decline. Initial support on the downside is near the $0.490 level and the 100-hourly Simple Moving Average.
The next major support is at $0.4850. If there is a downside break and a close below the $0.4850 level, the price might gain bearish momentum. In the stated case, the price could even trade below the $0.4765 low in the near term.
Technical Indicators
Hourly MACD – The MACD for XRP/USD is now losing pace in the bearish zone.
Hourly RSI (Relative Strength Index) – The RSI for XRP/USD is now above the 50 level.
Major Support Levels – $0.4850 and $0.4765.
Major Resistance Levels – $0.4980 and $0.500.
What's Your Reaction?