


Solana Price Faces Uphill Task: Tough Road Ahead For SOL Bulls
Solana tested the $138 zone before it started a recovery wave. SOL price must clear the $150 and $155 resistance levels to start a steady increase. SOL price is eyeing an upside break above the $150 resistance against the US Dollar. The price is now trading above $145 and the 100-hourly simple moving average. There is a connecting bullish trend line forming with support at $146 on the hourly chart of the SOL/USD pair (data source from Kraken). The pair could clear the $152.50 resistance to start a short-term uptrend. Solana Price Eyes Steady Increase Solana price extended losses below the $150 level like Bitcoin and Ethereum. SOL even declined below the $142 support before the bulls appeared near the $138 level. A low was formed at $138.01 and the price recently started a decent recovery wave. The price was able to clear the $142 and $145 resistance levels. There was a move above the 50% Fib retracement level of the downward move from the $161.89 swing high to the $138.01 low. Solana price is now trading above $145 and the 100-hourly simple moving average. There is also a connecting bullish trend line forming with support at $146 on the hourly chart of the SOL/USD pair. Immediate resistance is near the $150 level. The next major resistance is near the $152.50 level or the 61.8% Fib retracement level of the downward move from the $161.89 swing high to the $138.01 low. A successful close above the $152.50 resistance could set the pace for another major increase. The next key resistance is near $156.50. Any more gains might send the price toward the $160 level. Another Decline in SOL? If SOL fails to rally above the $152.50 resistance, it could start another decline. Initial support on the downside is near the $145 level and the trend line. The first major support is near the $142 level, below which the price could test $138. If there is a close below the $132 support, the price could decline toward the $125 support in the near term. Technical Indicators Hourly MACD – The MACD for SOL/USD is losing pace in the bullish zone. Hourly Hours RSI (Relative Strength Index) – The RSI for SOL/USD is near the 50 level. Major Support Levels – $145, and $142. Major Resistance Levels – $152.50, $156.50, and $160.

Solana tested the $138 zone before it started a recovery wave. SOL price must clear the $150 and $155 resistance levels to start a steady increase.
- SOL price is eyeing an upside break above the $150 resistance against the US Dollar.
- The price is now trading above $145 and the 100-hourly simple moving average.
- There is a connecting bullish trend line forming with support at $146 on the hourly chart of the SOL/USD pair (data source from Kraken).
- The pair could clear the $152.50 resistance to start a short-term uptrend.
Solana Price Eyes Steady Increase
Solana price extended losses below the $150 level like Bitcoin and Ethereum. SOL even declined below the $142 support before the bulls appeared near the $138 level. A low was formed at $138.01 and the price recently started a decent recovery wave.
The price was able to clear the $142 and $145 resistance levels. There was a move above the 50% Fib retracement level of the downward move from the $161.89 swing high to the $138.01 low. Solana price is now trading above $145 and the 100-hourly simple moving average. There is also a connecting bullish trend line forming with support at $146 on the hourly chart of the SOL/USD pair.
Immediate resistance is near the $150 level. The next major resistance is near the $152.50 level or the 61.8% Fib retracement level of the downward move from the $161.89 swing high to the $138.01 low.
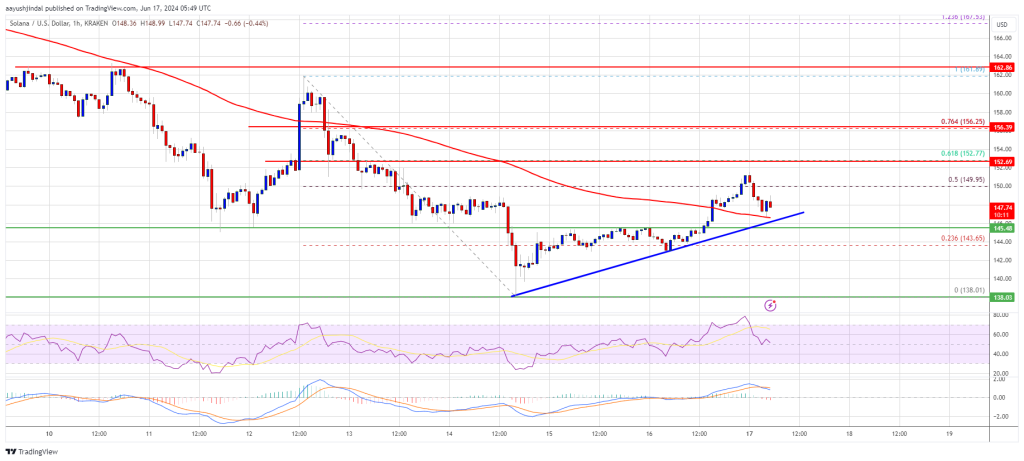
A successful close above the $152.50 resistance could set the pace for another major increase. The next key resistance is near $156.50. Any more gains might send the price toward the $160 level.
Another Decline in SOL?
If SOL fails to rally above the $152.50 resistance, it could start another decline. Initial support on the downside is near the $145 level and the trend line.
The first major support is near the $142 level, below which the price could test $138. If there is a close below the $132 support, the price could decline toward the $125 support in the near term.
Technical Indicators
Hourly MACD – The MACD for SOL/USD is losing pace in the bullish zone.
Hourly Hours RSI (Relative Strength Index) – The RSI for SOL/USD is near the 50 level.
Major Support Levels – $145, and $142.
Major Resistance Levels – $152.50, $156.50, and $160.
What's Your Reaction?