Solana Price (SOL) Could Spark Another Rally by Clearing $162
Solana started a fresh increase above the $150 resistance. SOL price could rally further if there is a clear move above the $162 resistance. SOL price started a fresh upward move above the $150 and $155 levels the US Dollar. The price is now trading above $155 and the 100-hourly simple moving average. There is a key bullish trend line forming with support at $158 on the hourly chart of the SOL/USD pair (data source from Kraken). The pair could start another increase if it clears the $162 resistance zone. Solana Price Regains Strength Above $155 Solana price started a fresh increase above the $150 resistance level. SOL remained stable and gained pace for a move above the $155 resistance level. It even cleared the $160 resistance level, beating Ethereum and Bitcoin. The price traded as high as $162 and is currently consolidating gains. There was a minor correction below the $160 level. The price tested the 23.6% Fib retracement level of the upward move from the $138 swing low to the $162 swing high. Solana is now trading well above $150 and the 100-hourly simple moving average. There is also a key bullish trend line forming with support at $158 on the hourly chart of the SOL/USD pair. On the upside, the price is facing resistance near the $162 level. The next major resistance is near the $165 level. A successful close above the $162 and $165 resistance levels could set the pace for another steady increase. The next key resistance is near $178. Any more gains might send the price toward the $184 level. Are Dips Limited in SOL? If SOL fails to rise above the $162 resistance, it could start a downside correction. Initial support on the downside is near the $158 level and the trend line. The first major support is near the $155 level. A break below the $155 level might send the price toward $148 or the 61.8% Fib retracement level of the upward move from the $138 swing low to the $162 swing high. If there is a close below the $148 support, the price could decline toward the $135 support in the near term. Technical Indicators Hourly MACD – The MACD for SOL/USD is gaining pace in the bullish zone. Hourly Hours RSI (Relative Strength Index) – The RSI for SOL/USD is above the 50 level. Major Support Levels – $158 and $155. Major Resistance Levels – $162 and $165.

Solana started a fresh increase above the $150 resistance. SOL price could rally further if there is a clear move above the $162 resistance.
- SOL price started a fresh upward move above the $150 and $155 levels the US Dollar.
- The price is now trading above $155 and the 100-hourly simple moving average.
- There is a key bullish trend line forming with support at $158 on the hourly chart of the SOL/USD pair (data source from Kraken).
- The pair could start another increase if it clears the $162 resistance zone.
Solana Price Regains Strength Above $155
Solana price started a fresh increase above the $150 resistance level. SOL remained stable and gained pace for a move above the $155 resistance level. It even cleared the $160 resistance level, beating Ethereum and Bitcoin.
The price traded as high as $162 and is currently consolidating gains. There was a minor correction below the $160 level. The price tested the 23.6% Fib retracement level of the upward move from the $138 swing low to the $162 swing high.
Solana is now trading well above $150 and the 100-hourly simple moving average. There is also a key bullish trend line forming with support at $158 on the hourly chart of the SOL/USD pair.
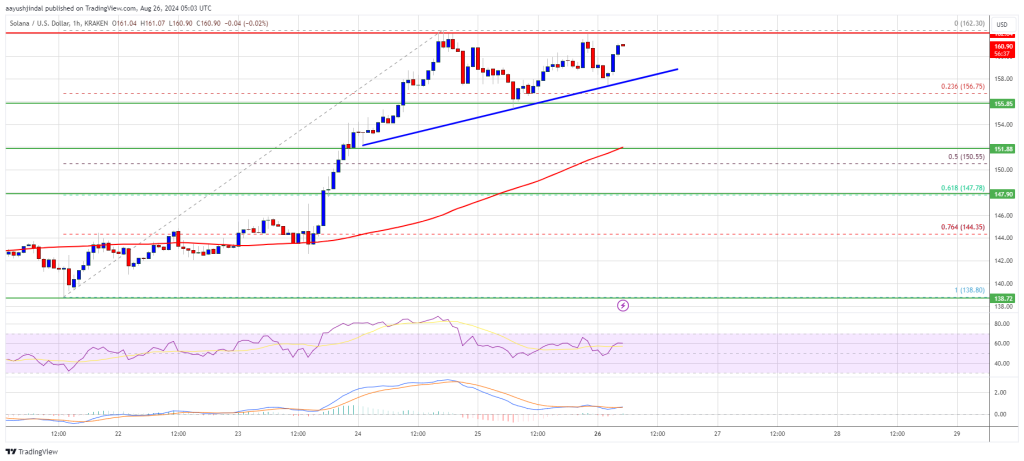
On the upside, the price is facing resistance near the $162 level. The next major resistance is near the $165 level. A successful close above the $162 and $165 resistance levels could set the pace for another steady increase. The next key resistance is near $178. Any more gains might send the price toward the $184 level.
Are Dips Limited in SOL?
If SOL fails to rise above the $162 resistance, it could start a downside correction. Initial support on the downside is near the $158 level and the trend line. The first major support is near the $155 level.
A break below the $155 level might send the price toward $148 or the 61.8% Fib retracement level of the upward move from the $138 swing low to the $162 swing high. If there is a close below the $148 support, the price could decline toward the $135 support in the near term.
Technical Indicators
Hourly MACD – The MACD for SOL/USD is gaining pace in the bullish zone.
Hourly Hours RSI (Relative Strength Index) – The RSI for SOL/USD is above the 50 level.
Major Support Levels – $158 and $155.
Major Resistance Levels – $162 and $165.
What's Your Reaction?