
Solana Price (SOL) Faces Challenges at $200: Bulls Remain Active
Solana extended gains above $180. SOL price is now struggling to reach the $200 level and showing some signs of a downside correction. SOL price started a downside correction from the $192 zone against the US Dollar. The price is now trading below $185 and the 100-hourly simple moving average. There was a break below a key bullish trend line with support at $187 on the hourly chart of the SOL/USD pair (data source from Kraken). The pair could start another increase unless it settles below the $175 support. Solana Price Fails To Test $200 Solana price remained in a positive zone and extended gains, beating Bitcoin and Ethereum. It traded above the $180 and $185 resistance levels. Finally, it tested the $192 zone and struggled to reach $200. A high was formed near $193.86 and the price started a downside correction. There was a move below the $190 and $188 support levels. The price dipped below the 23.6% Fib retracement level of the upward move from the $165 swing low to the $193 high. Besides, there was a break below a key bullish trend line with support at $187 on the hourly chart of the SOL/USD pair. Solana is now trading below $185 and the 100-hourly simple moving average. The bulls are now active near the $180 support and the 50% Fib retracement level of the upward move from the $165 swing low to the $193 high. On the upside, the price is facing resistance near the $185 level. The next major resistance is near the $188 level. A successful close above the $188 resistance could set the pace for another steady increase. The next key resistance is near $192. Any more gains might send the price toward the $200 level. More Losses in SOL? If SOL fails to rise above the $185 resistance, it could start another decline. Initial support on the downside is near the $180 level. The first major support is near the $175 level. A break below the $175 level might send the price toward $165. If there is a close below the $165 support, the price could decline toward the $155 support in the near term. Technical Indicators Hourly MACD – The MACD for SOL/USD is gaining pace in the bearish zone. Hourly Hours RSI (Relative Strength Index) – The RSI for SOL/USD is below the 50 level. Major Support Levels – $180 and $175. Major Resistance Levels – $185 and $188.

Solana extended gains above $180. SOL price is now struggling to reach the $200 level and showing some signs of a downside correction.
- SOL price started a downside correction from the $192 zone against the US Dollar.
- The price is now trading below $185 and the 100-hourly simple moving average.
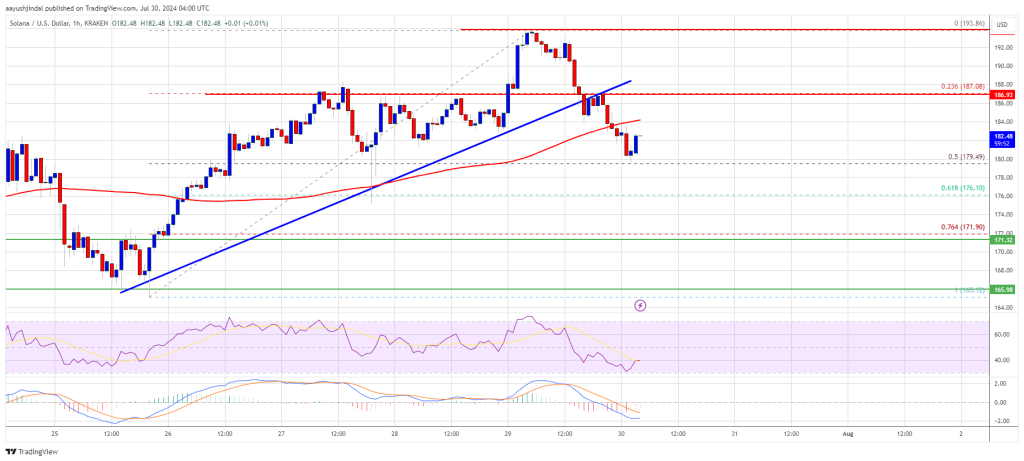
- There was a break below a key bullish trend line with support at $187 on the hourly chart of the SOL/USD pair (data source from Kraken).
- The pair could start another increase unless it settles below the $175 support.
Solana Price Fails To Test $200
Solana price remained in a positive zone and extended gains, beating Bitcoin and Ethereum. It traded above the $180 and $185 resistance levels. Finally, it tested the $192 zone and struggled to reach $200.
A high was formed near $193.86 and the price started a downside correction. There was a move below the $190 and $188 support levels. The price dipped below the 23.6% Fib retracement level of the upward move from the $165 swing low to the $193 high.
Besides, there was a break below a key bullish trend line with support at $187 on the hourly chart of the SOL/USD pair. Solana is now trading below $185 and the 100-hourly simple moving average.
The bulls are now active near the $180 support and the 50% Fib retracement level of the upward move from the $165 swing low to the $193 high. On the upside, the price is facing resistance near the $185 level. The next major resistance is near the $188 level.
A successful close above the $188 resistance could set the pace for another steady increase. The next key resistance is near $192. Any more gains might send the price toward the $200 level.
More Losses in SOL?
If SOL fails to rise above the $185 resistance, it could start another decline. Initial support on the downside is near the $180 level. The first major support is near the $175 level.
A break below the $175 level might send the price toward $165. If there is a close below the $165 support, the price could decline toward the $155 support in the near term.
Technical Indicators
Hourly MACD – The MACD for SOL/USD is gaining pace in the bearish zone.
Hourly Hours RSI (Relative Strength Index) – The RSI for SOL/USD is below the 50 level.
Major Support Levels – $180 and $175.
Major Resistance Levels – $185 and $188.
What's Your Reaction?