Solana Price (SOL) Gains Traction: Poised for Further Increase?
Solana started a decent upward move from the $110 zone. SOL price is rising and might increase further above the $155 resistance zone. SOL price started a recovery wave above the $135 and $140 levels against the US Dollar. The price is now trading above $145 and the 100-hourly simple moving average. There was a break above a key bearish trend line with resistance at $136 on the hourly chart of the SOL/USD pair (data source from Kraken). The pair could start another increase if it clears the $155 resistance zone. Solana Price Recovers 15% Solana price declined heavily below the $165 and $150 levels like Bitcoin and Ethereum. It even traded below the $120 support before the bulls appeared. A low was formed at $109 and SOL recently started a recovery wave. There was a move above the $120 and $135 resistance levels. The price climbed above the 50% Fib retracement level of the downward move from the $184 swing high to the $109 low. Besides, there was a break above a key bearish trend line with resistance at $136 on the hourly chart of the SOL/USD pair. Solana is now trading above $145 and the 100-hourly simple moving average. On the upside, the price is facing resistance near the $155 level. It is close to the 61.8% Fib retracement level of the downward move from the $184 swing high to the $109 low. The next major resistance is near the $166 level. A successful close above the $166 resistance could set the pace for another steady increase. The next key resistance is near $184. Any more gains might send the price toward the $195 level. Another Decline in SOL? If SOL fails to rise above the $155 resistance, it could start another decline. Initial support on the downside is near the $140 level. The first major support is near the $135 level. A break below the $135 level might send the price toward $122. If there is a close below the $122 support, the price could decline toward the $110 support in the near term. Technical Indicators Hourly MACD – The MACD for SOL/USD is gaining pace in the bullish zone. Hourly Hours RSI (Relative Strength Index) – The RSI for SOL/USD is above the 50 level. Major Support Levels – $140 and $135. Major Resistance Levels – $155 and $166.

Solana started a decent upward move from the $110 zone. SOL price is rising and might increase further above the $155 resistance zone.
- SOL price started a recovery wave above the $135 and $140 levels against the US Dollar.
- The price is now trading above $145 and the 100-hourly simple moving average.
- There was a break above a key bearish trend line with resistance at $136 on the hourly chart of the SOL/USD pair (data source from Kraken).
- The pair could start another increase if it clears the $155 resistance zone.
Solana Price Recovers 15%
Solana price declined heavily below the $165 and $150 levels like Bitcoin and Ethereum. It even traded below the $120 support before the bulls appeared. A low was formed at $109 and SOL recently started a recovery wave.
There was a move above the $120 and $135 resistance levels. The price climbed above the 50% Fib retracement level of the downward move from the $184 swing high to the $109 low. Besides, there was a break above a key bearish trend line with resistance at $136 on the hourly chart of the SOL/USD pair.
Solana is now trading above $145 and the 100-hourly simple moving average. On the upside, the price is facing resistance near the $155 level. It is close to the 61.8% Fib retracement level of the downward move from the $184 swing high to the $109 low.
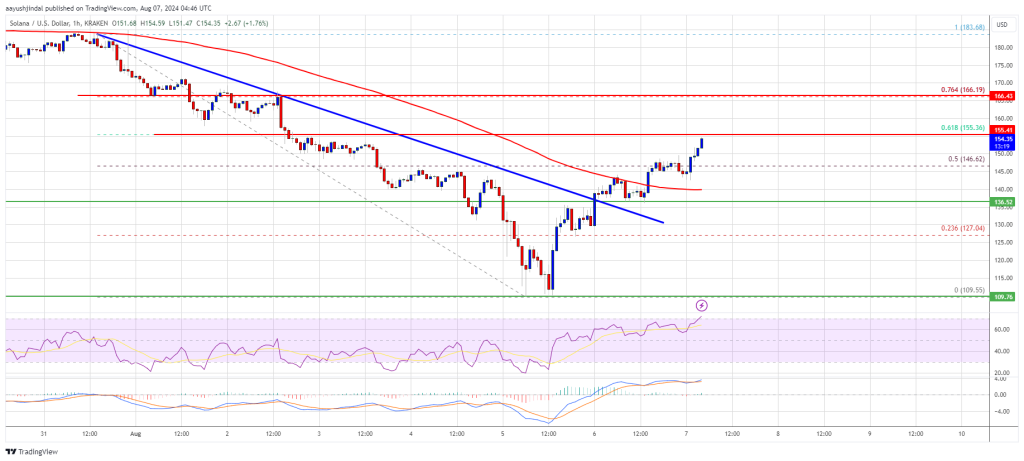
The next major resistance is near the $166 level. A successful close above the $166 resistance could set the pace for another steady increase. The next key resistance is near $184. Any more gains might send the price toward the $195 level.
Another Decline in SOL?
If SOL fails to rise above the $155 resistance, it could start another decline. Initial support on the downside is near the $140 level. The first major support is near the $135 level.
A break below the $135 level might send the price toward $122. If there is a close below the $122 support, the price could decline toward the $110 support in the near term.
Technical Indicators
Hourly MACD – The MACD for SOL/USD is gaining pace in the bullish zone.
Hourly Hours RSI (Relative Strength Index) – The RSI for SOL/USD is above the 50 level.
Major Support Levels – $140 and $135.
Major Resistance Levels – $155 and $166.
What's Your Reaction?