

Solana Price (SOL) Targets New Monthly High: Bulls in Control
Solana started a fresh increase from the $165 zone. SOL price is showing signs of strength and might climb further above the $182.50 resistance. SOL price started a decent upward move from the $165 support against the US Dollar. The price is now trading near $175 and the 100-hourly simple moving average. There was a break above a connecting bearish trend line with resistance at $170 on the hourly chart of the SOL/USD pair (data source from Kraken). The pair could aim for more upsides if it clears the $182.50 resistance level. Solana Price Remains In Positive Zone Above $165 Solana price started a downside correction from $152.50 like Bitcoin and Ethereum. It traded below the $175 and $172 support levels. There was a drop below the $170 level. Finally, it tested the $165 support. A low is formed at $165.12 and the price is again rising. There was a break above the $170 and $172 resistance levels. The price surpassed the 50% Fib retracement level of the downward move from the $182.51 swing high to the $165.12 low. Besides, there was a break above a connecting bearish trend line with resistance at $170 on the hourly chart of the SOL/USD pair. Solana is now trading near the $175 level. It seems to be struggling near the 61.8% Fib retracement level of the downward move from the $182.51 swing high to the $165.12 low. On the upside, the price is facing resistance near the $175 level. The next major resistance is near the $182.50 level. A successful close above the $182.50 resistance could set the pace for another steady increase. The next key resistance is near $192. Any more gains might send the price toward the $200 level. Are Dips Limited in SOL? If SOL fails to rise above the $182.50 resistance, it could start another decline. Initial support on the downside is near the $172 level. The first major support is near the $170 level. A break below the $170 level might send the price toward $165. If there is a close below the $165 support, the price could decline toward the $155 support in the near term. Technical Indicators Hourly MACD – The MACD for SOL/USD is gaining pace in the bullish zone. Hourly Hours RSI (Relative Strength Index) – The RSI for SOL/USD is above the 50 level. Major Support Levels – $172 and $170. Major Resistance Levels – $175 and $182.50.

Solana started a fresh increase from the $165 zone. SOL price is showing signs of strength and might climb further above the $182.50 resistance.
- SOL price started a decent upward move from the $165 support against the US Dollar.
- The price is now trading near $175 and the 100-hourly simple moving average.
- There was a break above a connecting bearish trend line with resistance at $170 on the hourly chart of the SOL/USD pair (data source from Kraken).
- The pair could aim for more upsides if it clears the $182.50 resistance level.
Solana Price Remains In Positive Zone Above $165
Solana price started a downside correction from $152.50 like Bitcoin and Ethereum. It traded below the $175 and $172 support levels. There was a drop below the $170 level.
Finally, it tested the $165 support. A low is formed at $165.12 and the price is again rising. There was a break above the $170 and $172 resistance levels. The price surpassed the 50% Fib retracement level of the downward move from the $182.51 swing high to the $165.12 low.
Besides, there was a break above a connecting bearish trend line with resistance at $170 on the hourly chart of the SOL/USD pair. Solana is now trading near the $175 level. It seems to be struggling near the 61.8% Fib retracement level of the downward move from the $182.51 swing high to the $165.12 low.
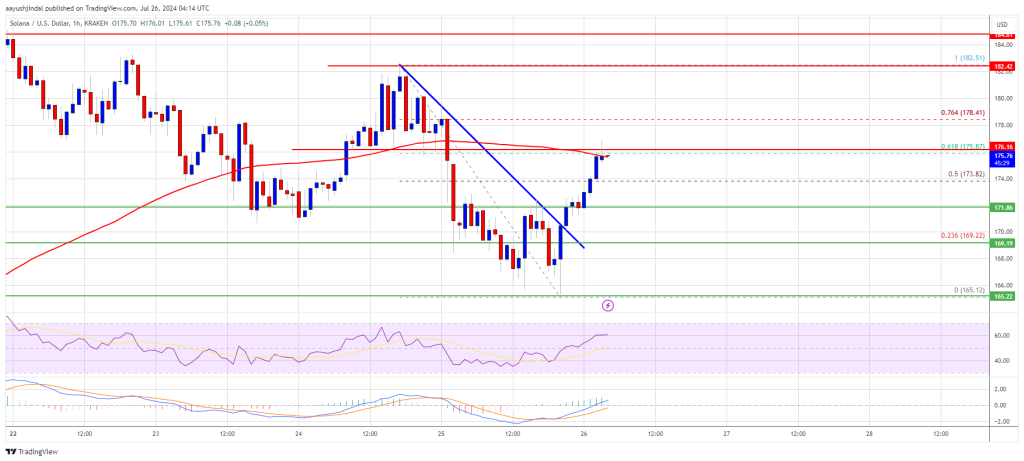
On the upside, the price is facing resistance near the $175 level. The next major resistance is near the $182.50 level. A successful close above the $182.50 resistance could set the pace for another steady increase. The next key resistance is near $192. Any more gains might send the price toward the $200 level.
Are Dips Limited in SOL?
If SOL fails to rise above the $182.50 resistance, it could start another decline. Initial support on the downside is near the $172 level. The first major support is near the $170 level.
A break below the $170 level might send the price toward $165. If there is a close below the $165 support, the price could decline toward the $155 support in the near term.
Technical Indicators
Hourly MACD – The MACD for SOL/USD is gaining pace in the bullish zone.
Hourly Hours RSI (Relative Strength Index) – The RSI for SOL/USD is above the 50 level.
Major Support Levels – $172 and $170.
Major Resistance Levels – $175 and $182.50.
What's Your Reaction?


