

Solana (SOL) Rockets Over 10%: Analyzing The Bullish Trend
Solana started strong increase above the $135 resistance. SOL price is up over 10% on the ETF hopes and it might rise further toward $162. SOL price started a steady increase and cleared the $142 resistance against the US Dollar. The price is now trading above $142 and the 100-hourly simple moving average. There is a connecting bullish trend line forming with support at $142 on the hourly chart of the SOL/USD pair (data source from Kraken). The pair could correct lower and find bids near the $140-$142 zone. Solana Price Starts Fresh Rally On ETF Fillings Solana price formed a base above the $125 level and started a fresh increase. SOL broke many hurdles near the $135 and $140 levels to move into a positive zone. It gained over 10%, cleared the $145 resistance, and outperformed Bitcoin and Ethereum. A high was formed at $150.93 and the price is now consolidating gains. It is trading near the 23.6% Fib retracement level of the upward move from the $135 swing low to the $151 high. Solana is now trading well above the $142 level and the 100-hourly simple moving average. There is also a connecting bullish trend line forming with support at $142 on the hourly chart of the SOL/USD pair. The trend line is close to the 50% Fib retracement level of the upward move from the $135 swing low to the $151 high. If there is another increase, the price might face resistance near the $150 level. The next major resistance is near the $152 level. A successful close above the $152 resistance could set the pace for another steady increase. The next key resistance is near $162. Any more gains might send the price toward the $175 level. Are Dips Supported in SOL? If SOL fails to rise above the $152 resistance, it could start another decline. Initial support on the downside is near the $145 level. The first major support is near the $142 level and the trend line, below which the price could test $140. If there is a close below the $140 support, the price could decline toward the $128 support in the near term. Technical Indicators Hourly MACD – The MACD for SOL/USD is gaining pace in the bullish zone. Hourly Hours RSI (Relative Strength Index) – The RSI for SOL/USD is above the 50 level. Major Support Levels – $145, and $142. Major Resistance Levels – $152 and $162.

Solana started strong increase above the $135 resistance. SOL price is up over 10% on the ETF hopes and it might rise further toward $162.
- SOL price started a steady increase and cleared the $142 resistance against the US Dollar.
- The price is now trading above $142 and the 100-hourly simple moving average.
- There is a connecting bullish trend line forming with support at $142 on the hourly chart of the SOL/USD pair (data source from Kraken).
- The pair could correct lower and find bids near the $140-$142 zone.
Solana Price Starts Fresh Rally On ETF Fillings
Solana price formed a base above the $125 level and started a fresh increase. SOL broke many hurdles near the $135 and $140 levels to move into a positive zone. It gained over 10%, cleared the $145 resistance, and outperformed Bitcoin and Ethereum.
A high was formed at $150.93 and the price is now consolidating gains. It is trading near the 23.6% Fib retracement level of the upward move from the $135 swing low to the $151 high.
Solana is now trading well above the $142 level and the 100-hourly simple moving average. There is also a connecting bullish trend line forming with support at $142 on the hourly chart of the SOL/USD pair. The trend line is close to the 50% Fib retracement level of the upward move from the $135 swing low to the $151 high.
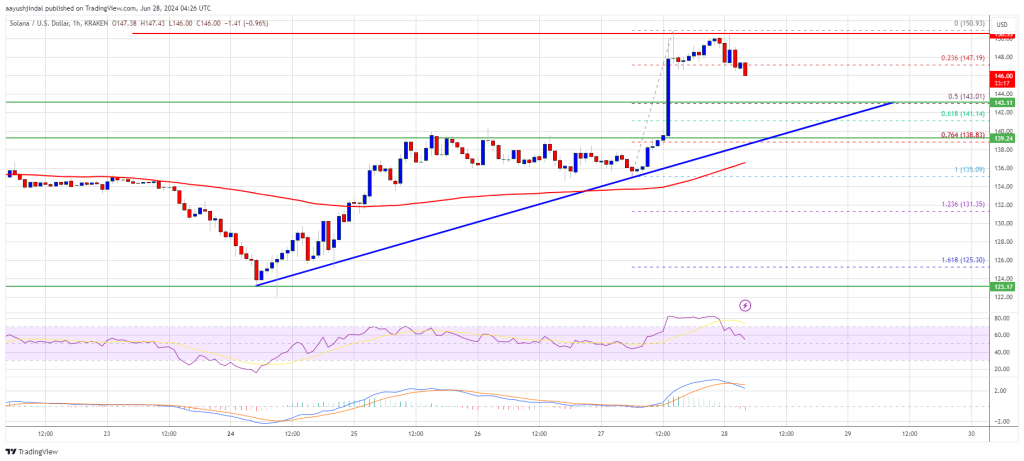
If there is another increase, the price might face resistance near the $150 level. The next major resistance is near the $152 level. A successful close above the $152 resistance could set the pace for another steady increase. The next key resistance is near $162. Any more gains might send the price toward the $175 level.
Are Dips Supported in SOL?
If SOL fails to rise above the $152 resistance, it could start another decline. Initial support on the downside is near the $145 level.
The first major support is near the $142 level and the trend line, below which the price could test $140. If there is a close below the $140 support, the price could decline toward the $128 support in the near term.
Technical Indicators
Hourly MACD – The MACD for SOL/USD is gaining pace in the bullish zone.
Hourly Hours RSI (Relative Strength Index) – The RSI for SOL/USD is above the 50 level.
Major Support Levels – $145, and $142.
Major Resistance Levels – $152 and $162.
What's Your Reaction?