


Toncoin Under Pressure As TON Price Falls Below 100-Day SMA, $6 Looms
Toncoin (TON) has recently seen a notable price decline, dropping below its 100-day Simple Moving Average (SMA). This breach of a critical technical indicator has placed the digital asset under bearish pressure, raising concerns among investors and traders. With the $6 mark now looming as a potential target, there is market speculation about whether the price will continue to decline or if a possible recovery could occur. This article aims to inform readers about the potential implications of Toncoin’s recent technical breach by providing an in-depth analysis of its market performance, specifically focusing on the price falling below the 100-day SMA. It also assesses possible future scenarios for TON’s price movement, exploring whether the digital asset will continue to decline toward the $6 mark or if a recovery might be imminent. At the time of writing, the price of Toncoin was trading around $6.75, up by 2%, with a market capitalization of over $16 billion and a trading volume exceeding $220 million. Over the last 24 hours, there has been a 2.01% increase in TON’s market capitalization, while its trading volume has decreased by 14.75%. Breaking Below The 100-Day SMA: A Technical Analysis After successfully crossing below the 100-day Simple Moving Average (SMA), the price of TON on the 4-hour chart is currently showing a short-term bullish correction, marked by a series of bullish candlesticks. However, it is important to note that the cryptocurrency may eventually decline toward the $6 support level again, as it remains trading below the 100-day SMA. Although the signal line of the Relative Strength Index (RSI) indicator on the 4-hour chart is attempting an upward move, it is still trending below the 50% level. This suggests that the current bullish trend may be short-lived, as momentum could shift from bullish to bearish, potentially driving the price towards the $6 support mark. On the 1-day chart, Toncoin is attempting to retest the 100-day SMA by forming a single bullish candlestick after breaching below it. Following this retest, the cryptocurrency asset may resume its downward movement towards the $6 support mark. Finally, it can be observed that the signal line of the 1-day RSI indicator has crossed below 50% and is currently moving towards the oversold zone. This positioning of the RSI indicator indicates a potential shift in momentum from bullish to bearish for TON’s price. Conclusion: Assessing The Long-Term Outlook For Toncoin Exploring TON’s long-term outlook reveals that if the coin’s momentum shifts from bullish to bearish, the price will begin to move downward toward the $6 support mark. When the price reaches this level and breaks below, it may move lower to test the $4.6 support mark and probably move on to test other lower support marks on the chart if the price breaches this level. However, should Toncoin reach the $6 support range and experience a rebound, it could begin to move upward toward the $7.75 resistance mark. If the price breaks through this resistance, it may continue to rise, testing its all-time high of $8.20 and potentially establishing a new all-time high when this mark is surpassed. Featured image from Adobe Stock, chart from Tradingview.com

Toncoin (TON) has recently seen a notable price decline, dropping below its 100-day Simple Moving Average (SMA). This breach of a critical technical indicator has placed the digital asset under bearish pressure, raising concerns among investors and traders. With the $6 mark now looming as a potential target, there is market speculation about whether the price will continue to decline or if a possible recovery could occur.
This article aims to inform readers about the potential implications of Toncoin’s recent technical breach by providing an in-depth analysis of its market performance, specifically focusing on the price falling below the 100-day SMA. It also assesses possible future scenarios for TON’s price movement, exploring whether the digital asset will continue to decline toward the $6 mark or if a recovery might be imminent.
At the time of writing, the price of Toncoin was trading around $6.75, up by 2%, with a market capitalization of over $16 billion and a trading volume exceeding $220 million. Over the last 24 hours, there has been a 2.01% increase in TON’s market capitalization, while its trading volume has decreased by 14.75%.
Breaking Below The 100-Day SMA: A Technical Analysis
After successfully crossing below the 100-day Simple Moving Average (SMA), the price of TON on the 4-hour chart is currently showing a short-term bullish correction, marked by a series of bullish candlesticks. However, it is important to note that the cryptocurrency may eventually decline toward the $6 support level again, as it remains trading below the 100-day SMA.
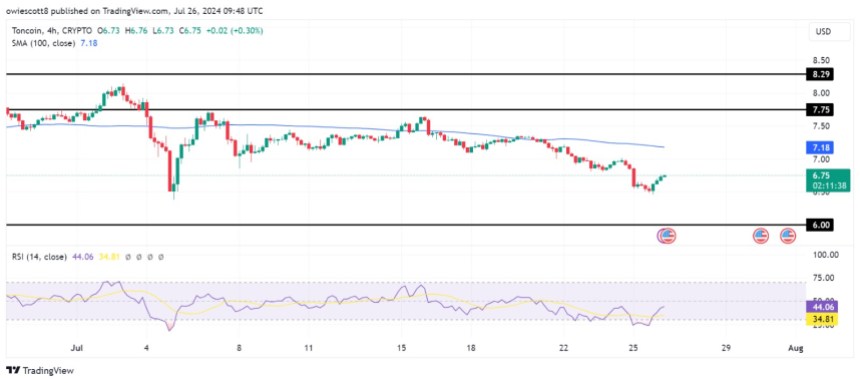
Although the signal line of the Relative Strength Index (RSI) indicator on the 4-hour chart is attempting an upward move, it is still trending below the 50% level. This suggests that the current bullish trend may be short-lived, as momentum could shift from bullish to bearish, potentially driving the price towards the $6 support mark.
On the 1-day chart, Toncoin is attempting to retest the 100-day SMA by forming a single bullish candlestick after breaching below it. Following this retest, the cryptocurrency asset may resume its downward movement towards the $6 support mark.

Finally, it can be observed that the signal line of the 1-day RSI indicator has crossed below 50% and is currently moving towards the oversold zone. This positioning of the RSI indicator indicates a potential shift in momentum from bullish to bearish for TON’s price.
Conclusion: Assessing The Long-Term Outlook For Toncoin
Exploring TON’s long-term outlook reveals that if the coin’s momentum shifts from bullish to bearish, the price will begin to move downward toward the $6 support mark. When the price reaches this level and breaks below, it may move lower to test the $4.6 support mark and probably move on to test other lower support marks on the chart if the price breaches this level.
However, should Toncoin reach the $6 support range and experience a rebound, it could begin to move upward toward the $7.75 resistance mark. If the price breaks through this resistance, it may continue to rise, testing its all-time high of $8.20 and potentially establishing a new all-time high when this mark is surpassed.
What's Your Reaction?