
Tron Price Outshines Bitcoin: Can TRX Keep Momentum and Rise?
Tron price is rising from the $0.1250 zone against the US Dollar. TRX is outperforming Bitcoin and could rise further above $0.1320. Tron is moving higher above the $0.1280 resistance level against the US dollar. The price is trading above $0.130 and the 100-hourly simple moving average. There is a key bullish trend line forming with support at $0.1305 on the hourly chart of the TRX/USD pair (data source from Kraken). The pair could continue to climb higher toward $0.1335 or even $0.1350. Tron Price Eyes More Upsides Recently, Bitcoin and Ethereum saw a fresh decline below $60,000 and $2,700 respectively. However, Tron price remained stable above the $0.1250 support and climbed higher. There was a decent move above the $0.1300 resistance zone. TRX price even tested the $0.1315 level. A high is formed at $0.1314 and the price is showing signs of more upsides. There is also a key bullish trend line forming with support at $0.1305 on the hourly chart of the TRX/USD pair. The trend line is close to the 23.6% Fib retracement level of the upward move from the $0.1256 swing low to the $0.1314 high. The price is now trading above $0.1300 and the 100-hourly simple moving average. On the upside, an initial resistance is near the $0.1320 level The first major resistance is near $0.1332, above which the price could accelerate higher. The next resistance is near $0.1350. A close above the $0.1350 resistance might send TRX further higher toward $0.1400. The next major resistance is near the $0.1420 level, above which the bulls are likely to aim for a larger increase toward $0.1450 in the near term. Are Dips Supported in TRX? If TRX price fails to clear the $0.1320 resistance, it could start a downside correction. Initial support on the downside is near the $0.1300 zone and the trend line. The first major support is near the $0.1285 level or the 50% Fib retracement level of the upward move from the $0.1256 swing low to the $0.1314 high, below which it could test $0.1280. Any more losses might send Tron toward the $0.1265 support in the coming sessions. Technical Indicators Hourly MACD – The MACD for TRX/USD is gaining momentum in the bullish zone. Hourly RSI (Relative Strength Index) – The RSI for TRX/USD is currently above the 50 level. Major Support Levels – $0.1300 and $0.1285. Major Resistance Levels – $0.1320 and $0.1350.

Tron price is rising from the $0.1250 zone against the US Dollar. TRX is outperforming Bitcoin and could rise further above $0.1320.
- Tron is moving higher above the $0.1280 resistance level against the US dollar.
- The price is trading above $0.130 and the 100-hourly simple moving average.
- There is a key bullish trend line forming with support at $0.1305 on the hourly chart of the TRX/USD pair (data source from Kraken).
- The pair could continue to climb higher toward $0.1335 or even $0.1350.
Tron Price Eyes More Upsides
Recently, Bitcoin and Ethereum saw a fresh decline below $60,000 and $2,700 respectively. However, Tron price remained stable above the $0.1250 support and climbed higher.
There was a decent move above the $0.1300 resistance zone. TRX price even tested the $0.1315 level. A high is formed at $0.1314 and the price is showing signs of more upsides. There is also a key bullish trend line forming with support at $0.1305 on the hourly chart of the TRX/USD pair.
The trend line is close to the 23.6% Fib retracement level of the upward move from the $0.1256 swing low to the $0.1314 high. The price is now trading above $0.1300 and the 100-hourly simple moving average. On the upside, an initial resistance is near the $0.1320 level
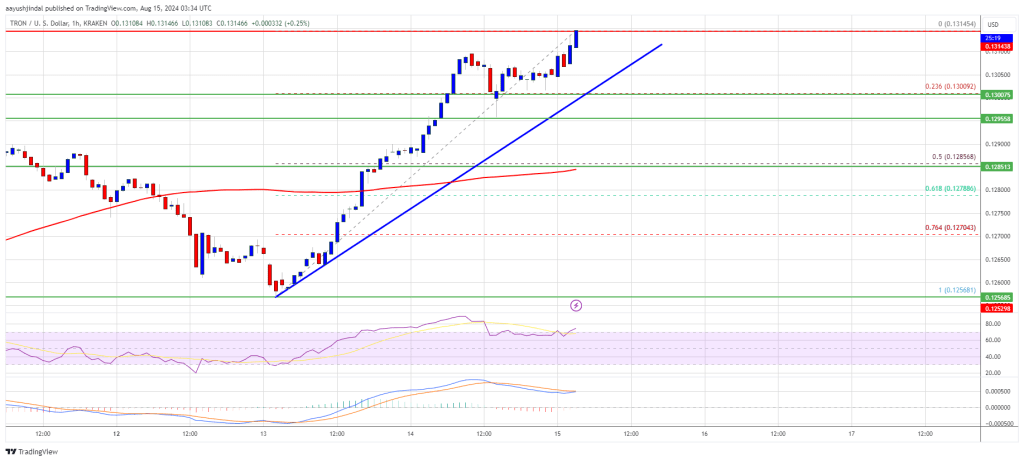
The first major resistance is near $0.1332, above which the price could accelerate higher. The next resistance is near $0.1350. A close above the $0.1350 resistance might send TRX further higher toward $0.1400. The next major resistance is near the $0.1420 level, above which the bulls are likely to aim for a larger increase toward $0.1450 in the near term.
Are Dips Supported in TRX?
If TRX price fails to clear the $0.1320 resistance, it could start a downside correction. Initial support on the downside is near the $0.1300 zone and the trend line.
The first major support is near the $0.1285 level or the 50% Fib retracement level of the upward move from the $0.1256 swing low to the $0.1314 high, below which it could test $0.1280. Any more losses might send Tron toward the $0.1265 support in the coming sessions.
Technical Indicators
Hourly MACD – The MACD for TRX/USD is gaining momentum in the bullish zone.
Hourly RSI (Relative Strength Index) – The RSI for TRX/USD is currently above the 50 level.
Major Support Levels – $0.1300 and $0.1285.
Major Resistance Levels – $0.1320 and $0.1350.
What's Your Reaction?