XRP Bulls Flex Muscles: Potential Uptrend in Play?
XRP price dipped but the bulls were active near the $0.4700 support. The price reclaimed the 100-hourly SMA and might continue to rise if it clears $0.4950. XRP price found support at $0.4700 and started a recovery wave. The price is now trading above $0.4800 and the 100-hourly Simple Moving Average. There was a break below a major bullish trend line with support at $0.4915 on the hourly chart of the XRP/USD pair (data source from Kraken). The pair could continue to rise unless it fails to stay above the $0.4820 support zone. XRP Price Aims Higher XRP price failed to clear the $0.520 resistance and reacted to the downside like Bitcoin and Ethereum. There was a sharp decline below the $0.500 and $0.4850 support levels. There was a break below a major bullish trend line with support at $0.4915 on the hourly chart of the XRP/USD pair. However, the bulls took a stand near $0.4700. The price started another upward move from the $0.4700 low. There was a move above the $0.4750 and $0.4820 resistance levels. The price even cleared the 23.6% Fib retracement level of the downward move from the $0.5202 swing high to the $0.4700 low. The price is now trading above $0.4800 and the 100-hourly Simple Moving Average. On the upside, the price is facing resistance near the $0.4950 level and the 50% Fib retracement level of the downward move from the $0.5202 swing high to the $0.4700 low. The first key resistance is near $0.500. The next major resistance is near the $0.520 level. A close above the $0.520 resistance zone could send the price higher. The next key resistance is near $0.5320. If there is a close above the $0.5320 resistance level, there could be a steady increase toward the $0.5500 resistance. Any more gains might send the price toward the $0.5550 resistance. Another Decline? If XRP fails to clear the $0.4950 resistance zone, it could start another decline. Initial support on the downside is near the $0.4865 level and the 100-hourly Simple Moving Average. The next major support is at $0.4820. If there is a downside break and a close below the $0.4820 level, the price might gain bearish momentum. In the stated case, the price could decline and retest the $0.4550 support in the near term. Technical Indicators Hourly MACD – The MACD for XRP/USD is now losing pace in the bearish zone. Hourly RSI (Relative Strength Index) – The RSI for XRP/USD is now below the 50 level. Major Support Levels – $0.4820 and $0.4700. Major Resistance Levels – $0.4950 and $0.500.

XRP price dipped but the bulls were active near the $0.4700 support. The price reclaimed the 100-hourly SMA and might continue to rise if it clears $0.4950.
- XRP price found support at $0.4700 and started a recovery wave.
- The price is now trading above $0.4800 and the 100-hourly Simple Moving Average.
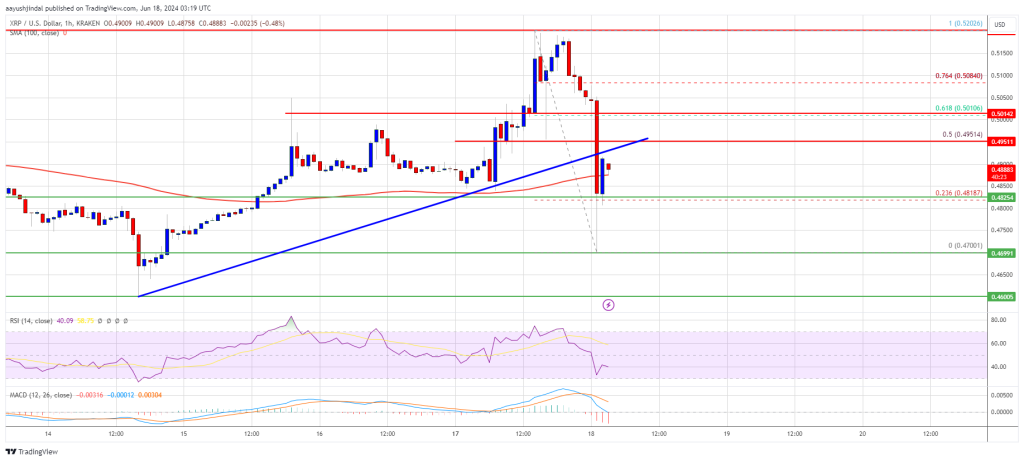
- There was a break below a major bullish trend line with support at $0.4915 on the hourly chart of the XRP/USD pair (data source from Kraken).
- The pair could continue to rise unless it fails to stay above the $0.4820 support zone.
XRP Price Aims Higher
XRP price failed to clear the $0.520 resistance and reacted to the downside like Bitcoin and Ethereum. There was a sharp decline below the $0.500 and $0.4850 support levels. There was a break below a major bullish trend line with support at $0.4915 on the hourly chart of the XRP/USD pair.
However, the bulls took a stand near $0.4700. The price started another upward move from the $0.4700 low. There was a move above the $0.4750 and $0.4820 resistance levels. The price even cleared the 23.6% Fib retracement level of the downward move from the $0.5202 swing high to the $0.4700 low.
The price is now trading above $0.4800 and the 100-hourly Simple Moving Average. On the upside, the price is facing resistance near the $0.4950 level and the 50% Fib retracement level of the downward move from the $0.5202 swing high to the $0.4700 low.
The first key resistance is near $0.500. The next major resistance is near the $0.520 level. A close above the $0.520 resistance zone could send the price higher. The next key resistance is near $0.5320. If there is a close above the $0.5320 resistance level, there could be a steady increase toward the $0.5500 resistance. Any more gains might send the price toward the $0.5550 resistance.
Another Decline?
If XRP fails to clear the $0.4950 resistance zone, it could start another decline. Initial support on the downside is near the $0.4865 level and the 100-hourly Simple Moving Average.
The next major support is at $0.4820. If there is a downside break and a close below the $0.4820 level, the price might gain bearish momentum. In the stated case, the price could decline and retest the $0.4550 support in the near term.
Technical Indicators
Hourly MACD – The MACD for XRP/USD is now losing pace in the bearish zone.
Hourly RSI (Relative Strength Index) – The RSI for XRP/USD is now below the 50 level.
Major Support Levels – $0.4820 and $0.4700.
Major Resistance Levels – $0.4950 and $0.500.
What's Your Reaction?