


XRP Price Beats BTC: Surging Higher and Aiming for More
XRP price is gaining pace above the $0.6320 resistance zone. The price is up over 6%, outperforming Bitcoin, and might rise further toward $0.6750. XRP price is gaining pace above the $0.6320 zone. The price is now trading above $0.640 and the 100-hourly Simple Moving Average. There is a key bullish trend line forming with support at $0.640 on the hourly chart of the XRP/USD pair (data source from Kraken). The pair could rise further if it clears the $0.6580 resistance zone. XRP Price Rallies Over 6% XRP price formed a base above the $0.60 zone and started a fresh increase. It cleared the $0.6120 and $0.6150 resistance levels to move into a positive zone. The price is up over 6%, outperforming Bitcoin and Ethereum, and might aim for more gains. A high is formed at $0.6582 and the price is now consolidating gains. It is above the 23.6% Fib retracement level of the upward move from the $0.6113 swing low to the $0.6582 high. The price is now trading above $0.640 and the 100-hourly Simple Moving Average. There is also a key bullish trend line forming with support at $0.640 on the hourly chart of the XRP/USD pair. If there is a fresh increase, the price could face resistance near the $0.6580 level. The first major resistance is near the $0.6650 level. The next key resistance could be $0.6720. A clear move above the $0.6720 resistance might send the price toward the $0.6850 resistance. The next major resistance is near the $0.6940 level. Any more gains might send the price toward the $0.700 resistance or even $0.720 in the near term. Are Dips Supported? If XRP fails to clear the $0.6580 resistance zone, it could start a downside correction. Initial support on the downside is near the $0.6450 level. The next major support is at $0.640 or the trend line. If there is a downside break and a close below the $0.640 level, the price might continue to decline toward the $0.6350 support in the near term. The next major support sits at $0.6220 or the 76.4% Fib retracement level of the upward move from the $0.6113 swing low to the $0.6582 high. Technical Indicators Hourly MACD – The MACD for XRP/USD is now gaining pace in the bullish zone. Hourly RSI (Relative Strength Index) – The RSI for XRP/USD is now above the 50 level. Major Support Levels – $0.6400 and $0.6350. Major Resistance Levels – $0.6580 and $0.6720.

XRP price is gaining pace above the $0.6320 resistance zone. The price is up over 6%, outperforming Bitcoin, and might rise further toward $0.6750.
- XRP price is gaining pace above the $0.6320 zone.
- The price is now trading above $0.640 and the 100-hourly Simple Moving Average.
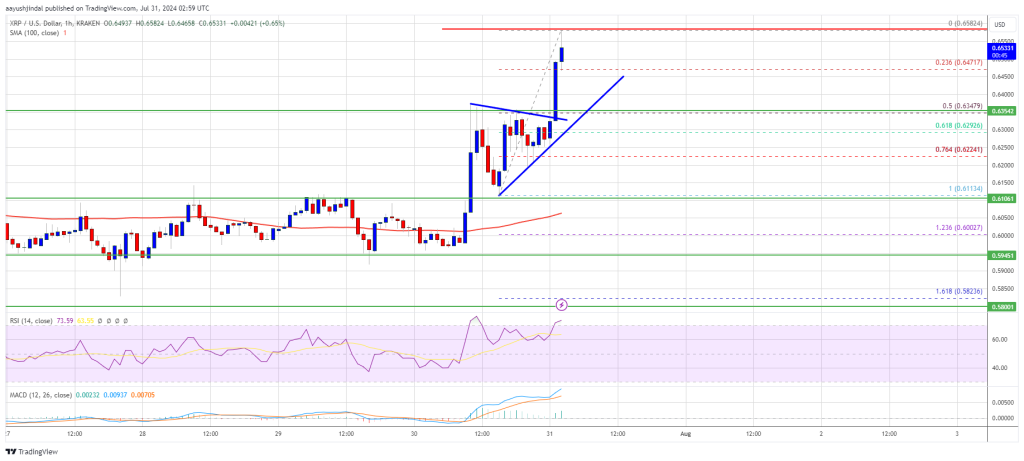
- There is a key bullish trend line forming with support at $0.640 on the hourly chart of the XRP/USD pair (data source from Kraken).
- The pair could rise further if it clears the $0.6580 resistance zone.
XRP Price Rallies Over 6%
XRP price formed a base above the $0.60 zone and started a fresh increase. It cleared the $0.6120 and $0.6150 resistance levels to move into a positive zone. The price is up over 6%, outperforming Bitcoin and Ethereum, and might aim for more gains.
A high is formed at $0.6582 and the price is now consolidating gains. It is above the 23.6% Fib retracement level of the upward move from the $0.6113 swing low to the $0.6582 high.
The price is now trading above $0.640 and the 100-hourly Simple Moving Average. There is also a key bullish trend line forming with support at $0.640 on the hourly chart of the XRP/USD pair. If there is a fresh increase, the price could face resistance near the $0.6580 level.
The first major resistance is near the $0.6650 level. The next key resistance could be $0.6720. A clear move above the $0.6720 resistance might send the price toward the $0.6850 resistance.
The next major resistance is near the $0.6940 level. Any more gains might send the price toward the $0.700 resistance or even $0.720 in the near term.
Are Dips Supported?
If XRP fails to clear the $0.6580 resistance zone, it could start a downside correction. Initial support on the downside is near the $0.6450 level. The next major support is at $0.640 or the trend line.
If there is a downside break and a close below the $0.640 level, the price might continue to decline toward the $0.6350 support in the near term. The next major support sits at $0.6220 or the 76.4% Fib retracement level of the upward move from the $0.6113 swing low to the $0.6582 high.
Technical Indicators
Hourly MACD – The MACD for XRP/USD is now gaining pace in the bullish zone.
Hourly RSI (Relative Strength Index) – The RSI for XRP/USD is now above the 50 level.
Major Support Levels – $0.6400 and $0.6350.
Major Resistance Levels – $0.6580 and $0.6720.
What's Your Reaction?


