


XRP Price Eyes $0.60 Reclaim: Crucial for a Fresh Upswing
XRP price is slowly moving higher above the $0.5650 support. The price must clear $0.5880 and $0.60 to start a fresh increase in the near term. XRP price is attempting a fresh increase above the $0.5650 level. The price is now trading near $0.5750 and the 100-hourly Simple Moving Average. There is a key rising channel forming with resistance at $0.5880 on the hourly chart of the XRP/USD pair (data source from Kraken). The pair could start a fresh increase if it clears the $0.5880 resistance zone. XRP Price Eyes Fresh Increase XRP price remained stable near the $0.550 level and started a fresh increase like Bitcoin and Ethereum. The price was able to climb above the $0.5620 and $0.5650 resistance levels. There was a move above the 50% Fib retracement level of the downward move from the $0.6020 swing high to the $0.5455 low. It seems like the bulls could soon attempt an upside break above the $0.600 resistance zone. However, the bears are active near the $0.5880 resistance zone. There is also a key rising channel forming with resistance at $0.5880 on the hourly chart of the XRP/USD pair. The price is now trading near $0.5750 and the 100-hourly Simple Moving Average. On the upside, the price is facing hurdles near the $0.5880 level. It is close to the 76.4% Fib retracement level of the downward move from the $0.6020 swing high to the $0.5455 low. The first major resistance is near the $0.60 level. The next key resistance could be $0.6020. A clear move above the $0.6020 resistance might send the price toward the $0.6150 resistance. The next major resistance is near the $0.6250 level. Any more gains might send the price toward the $0.6320 resistance or even $0.650 in the near term. Another Drop? If XRP fails to clear the $0.5880 resistance zone, it could start another decline. Initial support on the downside is near the $0.570 level. The next major support is at $0.5650. If there is a downside break and a close below the $0.5650 level, the price might continue to decline toward the $0.550 support. The next major support sits at $0.5350. Technical Indicators Hourly MACD – The MACD for XRP/USD is now gaining pace in the bullish zone. Hourly RSI (Relative Strength Index) – The RSI for XRP/USD is now above the 50 level. Major Support Levels – $0.5700 and $0.5650. Major Resistance Levels – $0.5880 and $0.6000.

XRP price is slowly moving higher above the $0.5650 support. The price must clear $0.5880 and $0.60 to start a fresh increase in the near term.
- XRP price is attempting a fresh increase above the $0.5650 level.
- The price is now trading near $0.5750 and the 100-hourly Simple Moving Average.
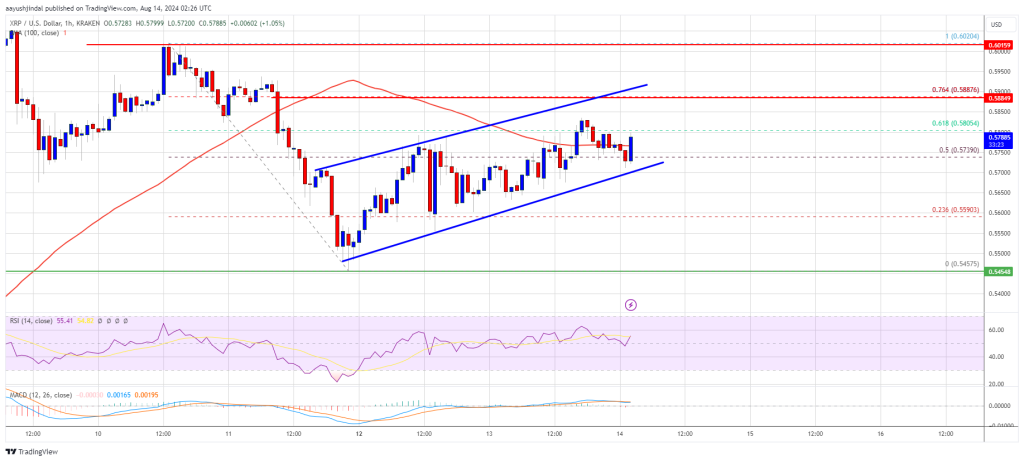
- There is a key rising channel forming with resistance at $0.5880 on the hourly chart of the XRP/USD pair (data source from Kraken).
- The pair could start a fresh increase if it clears the $0.5880 resistance zone.
XRP Price Eyes Fresh Increase
XRP price remained stable near the $0.550 level and started a fresh increase like Bitcoin and Ethereum. The price was able to climb above the $0.5620 and $0.5650 resistance levels.
There was a move above the 50% Fib retracement level of the downward move from the $0.6020 swing high to the $0.5455 low. It seems like the bulls could soon attempt an upside break above the $0.600 resistance zone. However, the bears are active near the $0.5880 resistance zone.
There is also a key rising channel forming with resistance at $0.5880 on the hourly chart of the XRP/USD pair. The price is now trading near $0.5750 and the 100-hourly Simple Moving Average.
On the upside, the price is facing hurdles near the $0.5880 level. It is close to the 76.4% Fib retracement level of the downward move from the $0.6020 swing high to the $0.5455 low. The first major resistance is near the $0.60 level.
The next key resistance could be $0.6020. A clear move above the $0.6020 resistance might send the price toward the $0.6150 resistance. The next major resistance is near the $0.6250 level. Any more gains might send the price toward the $0.6320 resistance or even $0.650 in the near term.
Another Drop?
If XRP fails to clear the $0.5880 resistance zone, it could start another decline. Initial support on the downside is near the $0.570 level. The next major support is at $0.5650.
If there is a downside break and a close below the $0.5650 level, the price might continue to decline toward the $0.550 support. The next major support sits at $0.5350.
Technical Indicators
Hourly MACD – The MACD for XRP/USD is now gaining pace in the bullish zone.
Hourly RSI (Relative Strength Index) – The RSI for XRP/USD is now above the 50 level.
Major Support Levels – $0.5700 and $0.5650.
Major Resistance Levels – $0.5880 and $0.6000.
What's Your Reaction?