


XRP Price On The Edge: Can It Survive and Start Fresh Increase
XRP price failed to climb above the $0.5850 resistance zone. The price dipped and now shows a few bearish signs below the $0.5750 level. XRP price is struggling to climb above the $0.5850 level. The price is now trading below $0.5750 and the 100-hourly Simple Moving Average. There was a break below a key rising channel with support at $0.5745 on the hourly chart of the XRP/USD pair (data source from Kraken). The pair could start a fresh increase if it clears the $0.580 resistance zone. XRP Price Dips To Support XRP price remained stable near the $0.5650 level and attempted more gains. However, it failed to clear the $0.5850 resistance and started another decline like Bitcoin and Ethereum. There was a move below the $0.580 and $0.5750 levels. The price dipped below the 23.6% Fib retracement level of the upward move from the $0.5457 swing low to the $0.5835 high. Besides, there was a break below a key rising channel with support at $0.5745 on the hourly chart of the XRP/USD pair. The price is now trading below $0.5750 and the 100-hourly Simple Moving Average. It is holding the 50% Fib retracement level of the upward move from the $0.5457 swing low to the $0.5835 high. On the upside, the price is facing hurdles near the $0.5750 level. The first major resistance is near the $0.580 level. The next key resistance could be $0.5850. A clear move above the $0.5850 resistance might send the price toward the $0.60 resistance. The next major resistance is near the $0.6150 level. Any more gains might send the price toward the $0.6250 resistance or even $0.6320 in the near term. More Losses? If XRP fails to clear the $0.580 resistance zone, it could start another decline. Initial support on the downside is near the $0.5650 level. The next major support is at $0.560. If there is a downside break and a close below the $0.5600 level, the price might continue to decline toward the $0.550 support in the near term. The next major support sits at $0.5350. Technical Indicators Hourly MACD – The MACD for XRP/USD is now losing pace in the bullish zone. Hourly RSI (Relative Strength Index) – The RSI for XRP/USD is now below the 50 level. Major Support Levels – $0.5600 and $0.5550. Major Resistance Levels – $0.5800 and $0.5850.

XRP price failed to climb above the $0.5850 resistance zone. The price dipped and now shows a few bearish signs below the $0.5750 level.
- XRP price is struggling to climb above the $0.5850 level.
- The price is now trading below $0.5750 and the 100-hourly Simple Moving Average.
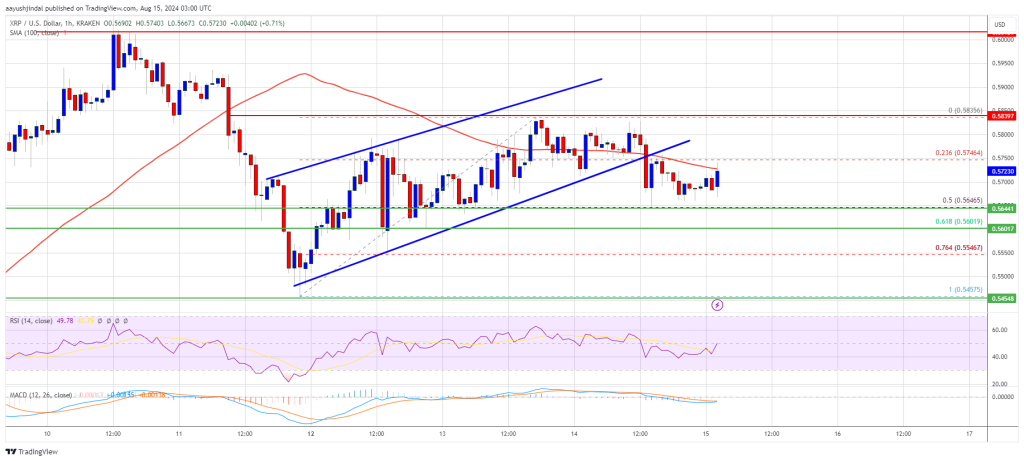
- There was a break below a key rising channel with support at $0.5745 on the hourly chart of the XRP/USD pair (data source from Kraken).
- The pair could start a fresh increase if it clears the $0.580 resistance zone.
XRP Price Dips To Support
XRP price remained stable near the $0.5650 level and attempted more gains. However, it failed to clear the $0.5850 resistance and started another decline like Bitcoin and Ethereum.
There was a move below the $0.580 and $0.5750 levels. The price dipped below the 23.6% Fib retracement level of the upward move from the $0.5457 swing low to the $0.5835 high. Besides, there was a break below a key rising channel with support at $0.5745 on the hourly chart of the XRP/USD pair.
The price is now trading below $0.5750 and the 100-hourly Simple Moving Average. It is holding the 50% Fib retracement level of the upward move from the $0.5457 swing low to the $0.5835 high.
On the upside, the price is facing hurdles near the $0.5750 level. The first major resistance is near the $0.580 level. The next key resistance could be $0.5850. A clear move above the $0.5850 resistance might send the price toward the $0.60 resistance. The next major resistance is near the $0.6150 level. Any more gains might send the price toward the $0.6250 resistance or even $0.6320 in the near term.
More Losses?
If XRP fails to clear the $0.580 resistance zone, it could start another decline. Initial support on the downside is near the $0.5650 level. The next major support is at $0.560.
If there is a downside break and a close below the $0.5600 level, the price might continue to decline toward the $0.550 support in the near term. The next major support sits at $0.5350.
Technical Indicators
Hourly MACD – The MACD for XRP/USD is now losing pace in the bullish zone.
Hourly RSI (Relative Strength Index) – The RSI for XRP/USD is now below the 50 level.
Major Support Levels – $0.5600 and $0.5550.
Major Resistance Levels – $0.5800 and $0.5850.
What's Your Reaction?