
XRP Price Poised for More Upsides: Will the Rally Continue?
XRP price is showing positive signs above the $0.5880 zone. The price could accelerate higher if there is a clear move above the $0.6240 resistance. XRP price started a fresh increase above the $0.5880 zone. The price is now trading above $0.600 and the 100-hourly Simple Moving Average. There is a key bullish trend line forming with support at $0.600 on the hourly chart of the XRP/USD pair (data source from Kraken). The pair could continue to rise if it clears the $0.6240 resistance zone. XRP Price Remains In Uptrend XRP price started another increase above the $0.5880 resistance. It outperformed Ethereum and Bitcoin with a decent increase above the $0.600 resistance zone. The bulls were able to pump the price toward the $0.6240 resistance zone. A high was formed at $0.6232 and the price is now consolidating gains. There was a minor decline below the $0.6150 level. The price dipped below the 23.6% Fib retracement level of the upward move from the $0.5733 swing low to the $0.6232 high. The price is now trading above $0.600 and the 100-hourly Simple Moving Average. There is also a key bullish trend line forming with support at $0.600 on the hourly chart of the XRP/USD pair. The trend line is close to the 50% Fib retracement level of the upward move from the $0.5733 swing low to the $0.6232 high. If there is a fresh upward move, the price could face resistance near the $0.620 level. The first major resistance is near the $0.6240 level. The next key resistance could be $0.6350. A clear move above the $0.6350 resistance might send the price toward the $0.6550 resistance. The next major resistance is near the $0.6800 level. Any more gains might send the price toward the $0.700 resistance. Another Dip? If XRP fails to clear the $0.6240 resistance zone, it could start another decline. Initial support on the downside is near the $0.600 level and the trend line. The next major support is at $0.5920. If there is a downside break and a close below the $0.5920 level, the price might continue to decline toward the $0.5450 support in the near term. Technical Indicators Hourly MACD – The MACD for XRP/USD is now gaining pace in the bullish zone. Hourly RSI (Relative Strength Index) – The RSI for XRP/USD is now above the 50 level. Major Support Levels – $0.6000 and $0.5920. Major Resistance Levels – $0.6240 and $0.6350.
XRP price is showing positive signs above the $0.5880 zone. The price could accelerate higher if there is a clear move above the $0.6240 resistance.
- XRP price started a fresh increase above the $0.5880 zone.
- The price is now trading above $0.600 and the 100-hourly Simple Moving Average.
- There is a key bullish trend line forming with support at $0.600 on the hourly chart of the XRP/USD pair (data source from Kraken).
- The pair could continue to rise if it clears the $0.6240 resistance zone.
XRP Price Remains In Uptrend
XRP price started another increase above the $0.5880 resistance. It outperformed Ethereum and Bitcoin with a decent increase above the $0.600 resistance zone.
The bulls were able to pump the price toward the $0.6240 resistance zone. A high was formed at $0.6232 and the price is now consolidating gains. There was a minor decline below the $0.6150 level. The price dipped below the 23.6% Fib retracement level of the upward move from the $0.5733 swing low to the $0.6232 high.
The price is now trading above $0.600 and the 100-hourly Simple Moving Average. There is also a key bullish trend line forming with support at $0.600 on the hourly chart of the XRP/USD pair. The trend line is close to the 50% Fib retracement level of the upward move from the $0.5733 swing low to the $0.6232 high.
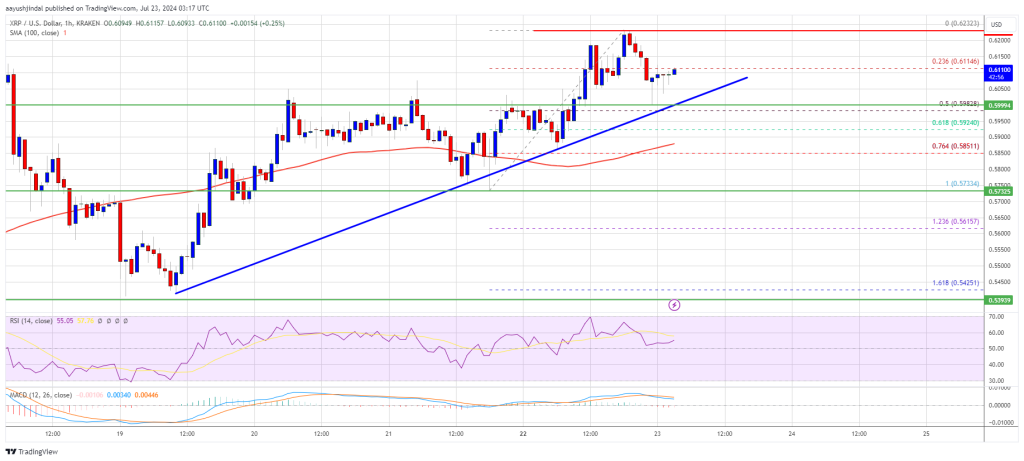
If there is a fresh upward move, the price could face resistance near the $0.620 level. The first major resistance is near the $0.6240 level. The next key resistance could be $0.6350. A clear move above the $0.6350 resistance might send the price toward the $0.6550 resistance. The next major resistance is near the $0.6800 level. Any more gains might send the price toward the $0.700 resistance.
Another Dip?
If XRP fails to clear the $0.6240 resistance zone, it could start another decline. Initial support on the downside is near the $0.600 level and the trend line. The next major support is at $0.5920.
If there is a downside break and a close below the $0.5920 level, the price might continue to decline toward the $0.5450 support in the near term.
Technical Indicators
Hourly MACD – The MACD for XRP/USD is now gaining pace in the bullish zone.
Hourly RSI (Relative Strength Index) – The RSI for XRP/USD is now above the 50 level.
Major Support Levels – $0.6000 and $0.5920.
Major Resistance Levels – $0.6240 and $0.6350.
What's Your Reaction?