


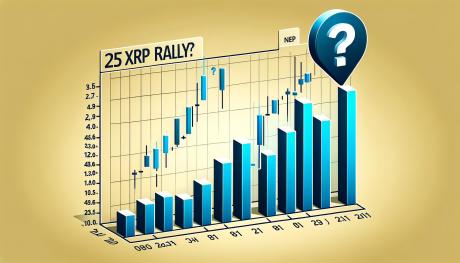
XRP Price Rallies 25%: Can This Breakout Continue?
XRP price started a major increase above $0.500 after court’s ruling. The price is up over 25% and eyes more upsides above the $0.640 resistance. XRP price started a strong increase above the $0.500 and $0.550 levels. The price is now trading above $0.5880 and the 100-hourly Simple Moving Average. There is a connecting bullish trend line forming with support at $0.5280 on the hourly chart of the XRP/USD pair (data source from Kraken). The pair could continue to rise if it clears the $0.640 resistance zone. XRP Price Starts Fresh Surge XRP price formed a base above $0.450 and started a major increase beating Ethereum and Bitcoin. The price was able to surpass the $0.5150 and $0.550 resistance levels. It gained over 25% and broke many hurdles near the $0.600 level. A high was formed at $0.6473 and the price recently corrected some gains. There was a move below the $0.600 level. The price dipped below the 23.6% Fib retracement level of the upward move from the $0.4922 swing low to the $0.6477 high. However, the bulls are active near $0.5880. It is still trading above $0.600 and the 100-hourly Simple Moving Average. On the upside, the price is facing hurdles near the $0.6250 level. The first major resistance is near the $0.6350 level. The next key resistance could be $0.640. A clear move above the $0.640 resistance might send the price toward the $0.6550 resistance. The next major resistance is near the $0.6880 level. Any more gains might send the price toward the $0.700 resistance or even $0.720 in the near term. Are Dips Supported? If XRP fails to clear the $0.620 resistance zone, it could start another decline. Initial support on the downside is near the $0.600 level. The next major support is at $0.5880. If there is a downside break and a close below the $0.5880 level, the price might continue to decline toward the $0.570 support or the 50% Fib retracement level of the upward move from the $0.4922 swing low to the $0.6477 high. The next major support sits at $0.540. Technical Indicators Hourly MACD – The MACD for XRP/USD is now gaining pace in the bullish zone. Hourly RSI (Relative Strength Index) – The RSI for XRP/USD is now above the 50 level. Major Support Levels – $0.600 and $0.5880. Major Resistance Levels – $0.6200 and $0.6400.
XRP price started a major increase above $0.500 after court’s ruling. The price is up over 25% and eyes more upsides above the $0.640 resistance.
- XRP price started a strong increase above the $0.500 and $0.550 levels.
- The price is now trading above $0.5880 and the 100-hourly Simple Moving Average.
- There is a connecting bullish trend line forming with support at $0.5280 on the hourly chart of the XRP/USD pair (data source from Kraken).
- The pair could continue to rise if it clears the $0.640 resistance zone.
XRP Price Starts Fresh Surge
XRP price formed a base above $0.450 and started a major increase beating Ethereum and Bitcoin. The price was able to surpass the $0.5150 and $0.550 resistance levels.
It gained over 25% and broke many hurdles near the $0.600 level. A high was formed at $0.6473 and the price recently corrected some gains. There was a move below the $0.600 level. The price dipped below the 23.6% Fib retracement level of the upward move from the $0.4922 swing low to the $0.6477 high.
However, the bulls are active near $0.5880. It is still trading above $0.600 and the 100-hourly Simple Moving Average. On the upside, the price is facing hurdles near the $0.6250 level.
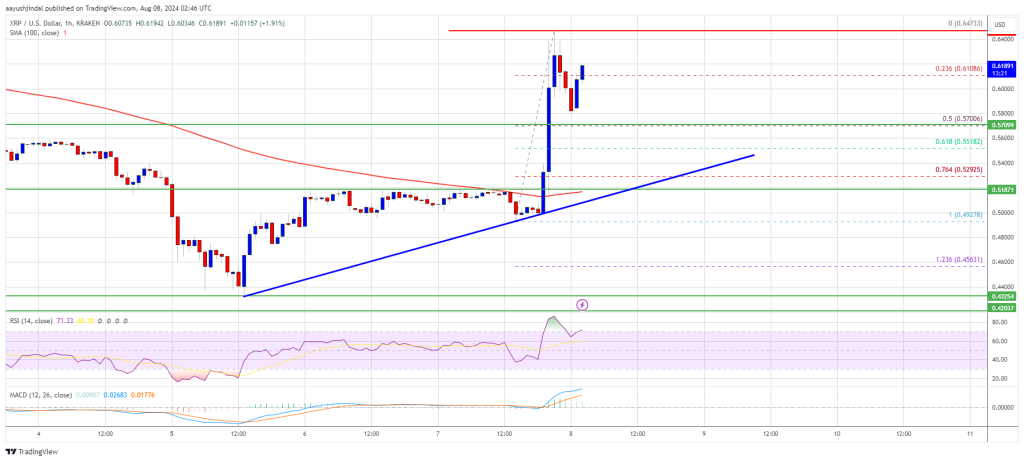
The first major resistance is near the $0.6350 level. The next key resistance could be $0.640. A clear move above the $0.640 resistance might send the price toward the $0.6550 resistance. The next major resistance is near the $0.6880 level. Any more gains might send the price toward the $0.700 resistance or even $0.720 in the near term.
Are Dips Supported?
If XRP fails to clear the $0.620 resistance zone, it could start another decline. Initial support on the downside is near the $0.600 level. The next major support is at $0.5880.
If there is a downside break and a close below the $0.5880 level, the price might continue to decline toward the $0.570 support or the 50% Fib retracement level of the upward move from the $0.4922 swing low to the $0.6477 high. The next major support sits at $0.540.
Technical Indicators
Hourly MACD – The MACD for XRP/USD is now gaining pace in the bullish zone.
Hourly RSI (Relative Strength Index) – The RSI for XRP/USD is now above the 50 level.
Major Support Levels – $0.600 and $0.5880.
Major Resistance Levels – $0.6200 and $0.6400.
What's Your Reaction?