


XRP Price Set To Breakout: Will It Trigger A Strong Rally?
XRP price is consolidating gains above the $0.5550 level. The price could gain bullish momentum if it clears the $0.580 resistance zone. XRP price is eyeing a fresh increase from the $0.5620 level. The price is now trading above $0.5680 and the 100-hourly Simple Moving Average. There is a key rising channel forming with support at $0.5630 on the hourly chart of the XRP/USD pair (data source from Kraken). The pair could start a fresh increase if it clears the $0.580 resistance zone. XRP Price Holds Uptrend Support XRP price remained stable near the $0.5550 level and attempted more gains. It formed a base and started a fresh increase beating Bitcoin and Ethereum. There was a move above the $0.5650 resistance zone. There was a move above the 50% Fib retracement level of the downward move from the $0.5760 swing high to the $0.5614 swing low. The price is now showing positive signs and rising toward the $0.5750 resistance. It is also trading above $0.5680 and the 100-hourly Simple Moving Average. Besides, there is a key rising channel forming with support at $0.5630 on the hourly chart of the XRP/USD pair. On the upside, the price is facing hurdles near the $0.5725 level. It is close to the 76.4% Fib retracement level of the downward move from the $0.5760 swing high to the $0.5614 swing low. The first major resistance is near the $0.5750 level. The next key resistance could be $0.580. A clear move above the $0.580 resistance might send the price toward the $0.6120 resistance. The next major resistance is near the $0.6250 level. Any more gains might send the price toward the $0.6350 resistance or even $0.650 in the near term. Another Decline? If XRP fails to clear the $0.5750 resistance zone, it could start another decline. Initial support on the downside is near the $0.5640 level. The next major support is at $0.5620. If there is a downside break and a close below the $0.5620 level, the price might continue to decline toward the $0.5550 support in the near term. The next major support sits at $0.5350. Technical Indicators Hourly MACD – The MACD for XRP/USD is now gaining pace in the bullish zone. Hourly RSI (Relative Strength Index) – The RSI for XRP/USD is now above the 50 level. Major Support Levels – $0.5620 and $0.5550. Major Resistance Levels – $0.5750 and $0.5800.

XRP price is consolidating gains above the $0.5550 level. The price could gain bullish momentum if it clears the $0.580 resistance zone.
- XRP price is eyeing a fresh increase from the $0.5620 level.
- The price is now trading above $0.5680 and the 100-hourly Simple Moving Average.
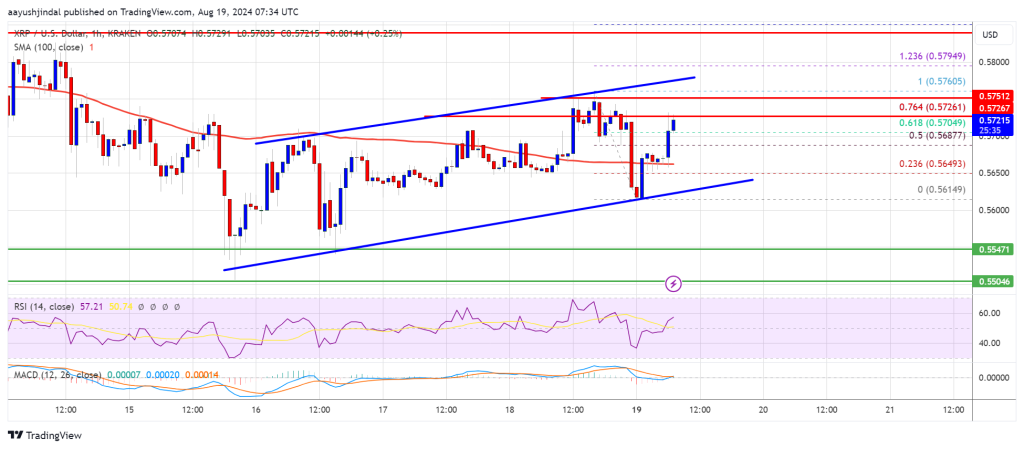
- There is a key rising channel forming with support at $0.5630 on the hourly chart of the XRP/USD pair (data source from Kraken).
- The pair could start a fresh increase if it clears the $0.580 resistance zone.
XRP Price Holds Uptrend Support
XRP price remained stable near the $0.5550 level and attempted more gains. It formed a base and started a fresh increase beating Bitcoin and Ethereum. There was a move above the $0.5650 resistance zone.
There was a move above the 50% Fib retracement level of the downward move from the $0.5760 swing high to the $0.5614 swing low. The price is now showing positive signs and rising toward the $0.5750 resistance. It is also trading above $0.5680 and the 100-hourly Simple Moving Average.
Besides, there is a key rising channel forming with support at $0.5630 on the hourly chart of the XRP/USD pair. On the upside, the price is facing hurdles near the $0.5725 level. It is close to the 76.4% Fib retracement level of the downward move from the $0.5760 swing high to the $0.5614 swing low.
The first major resistance is near the $0.5750 level. The next key resistance could be $0.580. A clear move above the $0.580 resistance might send the price toward the $0.6120 resistance. The next major resistance is near the $0.6250 level. Any more gains might send the price toward the $0.6350 resistance or even $0.650 in the near term.
Another Decline?
If XRP fails to clear the $0.5750 resistance zone, it could start another decline. Initial support on the downside is near the $0.5640 level. The next major support is at $0.5620.
If there is a downside break and a close below the $0.5620 level, the price might continue to decline toward the $0.5550 support in the near term. The next major support sits at $0.5350.
Technical Indicators
Hourly MACD – The MACD for XRP/USD is now gaining pace in the bullish zone.
Hourly RSI (Relative Strength Index) – The RSI for XRP/USD is now above the 50 level.
Major Support Levels – $0.5620 and $0.5550.
Major Resistance Levels – $0.5750 and $0.5800.
What's Your Reaction?