


XRP Price Surges Ahead: Bullish Trends Signal Promising Price Upswing!
XRP price is again gaining bullish momentum above the $0.520 resistance zone. The price is eyeing more upsides above $0.550 and $0.5650. XRP price started another increase above the $0.5250 resistance zone. The price is now trading above $0.540 and the 100-hourly Simple Moving Average. There is a key bullish trend line forming with support at $0.5220 on the hourly chart of the XRP/USD pair (data source from Kraken). The pair could extend gains if there is a close above the $0.5620 resistance level. XRP Price Regains Strength XRP price formed a base above the $0.500 level and started a fresh increase. The price broke the $0.5250 resistance to move again into a positive zone like Ethereum and Bitcoin. There was also a move above the $0.550 resistance level. A high was formed at $0.5610 and the price is now consolidating gains above the 23.6% Fib retracement level of the upward move from the $0.5227 swing low to the $0.5610 high. The price is now trading above $0.5420 and the 100-hourly Simple Moving Average. Besides, there is a key bullish trend line forming with support at $0.5220 on the hourly chart of the XRP/USD pair. On the upside, the price is facing resistance near the $0.5610 level. The first major resistance is near the $0.5620 level. The next key resistance could be $0.5650. A clear move above the $0.5650 resistance might send the price toward the $0.5740 resistance. The next major resistance is near the $0.580 level. Any more gains might send the price toward the $0.600 resistance. Are Dips Limited? If XRP fails to clear the $0.5620 resistance zone, it could start a downside correction. Initial support on the downside is near the $0.5420 level and the 50% Fib retracement level of the upward move from the $0.5227 swing low to the $0.5610 high. The next major support is at $0.5280 and the trend line. If there is a downside break and a close below the $0.5280 level, the price might continue to decline toward the $0.5050 support in the near term. Technical Indicators Hourly MACD – The MACD for XRP/USD is now gaining pace in the bullish zone. Hourly RSI (Relative Strength Index) – The RSI for XRP/USD is now above the 50 level. Major Support Levels – $0.5420 and $0.5280. Major Resistance Levels – $0.5620 and $0.5650.
XRP price is again gaining bullish momentum above the $0.520 resistance zone. The price is eyeing more upsides above $0.550 and $0.5650.
- XRP price started another increase above the $0.5250 resistance zone.
- The price is now trading above $0.540 and the 100-hourly Simple Moving Average.
- There is a key bullish trend line forming with support at $0.5220 on the hourly chart of the XRP/USD pair (data source from Kraken).
- The pair could extend gains if there is a close above the $0.5620 resistance level.
XRP Price Regains Strength
XRP price formed a base above the $0.500 level and started a fresh increase. The price broke the $0.5250 resistance to move again into a positive zone like Ethereum and Bitcoin.
There was also a move above the $0.550 resistance level. A high was formed at $0.5610 and the price is now consolidating gains above the 23.6% Fib retracement level of the upward move from the $0.5227 swing low to the $0.5610 high.
The price is now trading above $0.5420 and the 100-hourly Simple Moving Average. Besides, there is a key bullish trend line forming with support at $0.5220 on the hourly chart of the XRP/USD pair.
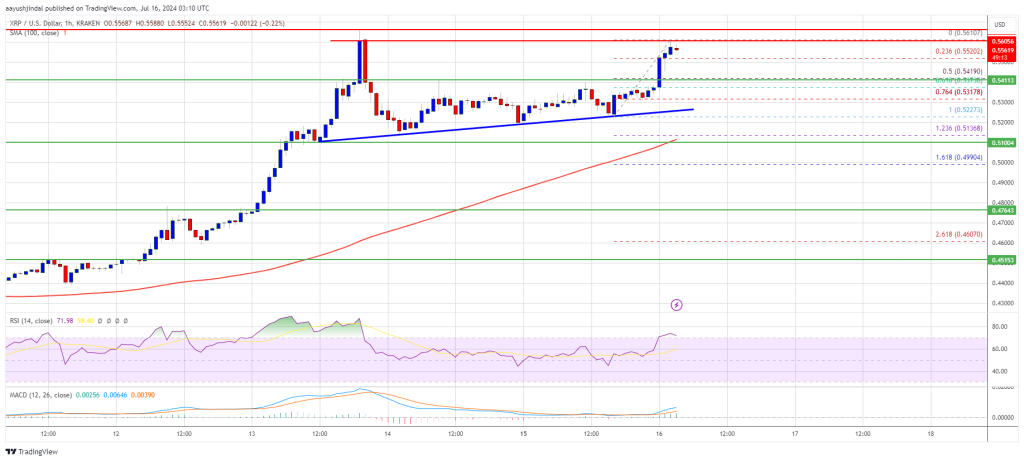
On the upside, the price is facing resistance near the $0.5610 level. The first major resistance is near the $0.5620 level. The next key resistance could be $0.5650. A clear move above the $0.5650 resistance might send the price toward the $0.5740 resistance. The next major resistance is near the $0.580 level. Any more gains might send the price toward the $0.600 resistance.
Are Dips Limited?
If XRP fails to clear the $0.5620 resistance zone, it could start a downside correction. Initial support on the downside is near the $0.5420 level and the 50% Fib retracement level of the upward move from the $0.5227 swing low to the $0.5610 high.
The next major support is at $0.5280 and the trend line. If there is a downside break and a close below the $0.5280 level, the price might continue to decline toward the $0.5050 support in the near term.
Technical Indicators
Hourly MACD – The MACD for XRP/USD is now gaining pace in the bullish zone.
Hourly RSI (Relative Strength Index) – The RSI for XRP/USD is now above the 50 level.
Major Support Levels – $0.5420 and $0.5280.
Major Resistance Levels – $0.5620 and $0.5650.
What's Your Reaction?