XRP Price Targets Strong Recovery: Key Indicators and Predictions
XRP price extended losses and tested the $0.4620 support. The price is now recovering and might gain bullish momentum if it clears the $0.4825 resistance. XRP price remained in a bearish zone and tested the $0.4620 support zone. The price is now trading below $0.4820 and the 100-hourly Simple Moving Average. There is a key bearish trend line forming with resistance at $0.4785 on the hourly chart of the XRP/USD pair (data source from Kraken). The pair could recover steadily if there is a move above $0.4800 and $0.4820. XRP Price Forms Support XRP price failed to clear the $0.4820 resistance zone and started another decline like Bitcoin and Ethereum. There was a move below the $0.480 and $0.4750 levels. The price even spiked below $0.4650. However, the bulls were active near $0.4620. A low was formed at $0.4619 and the price is now recovering losses. There was an upward move above the $0.4680 and $0.4720 resistance levels. The price cleared the 50% Fib retracement level of the downward move from the $0.4885 swing high to the $0.4619 low. It is now trading below $0.4850 and the 100-hourly Simple Moving Average. On the upside, the price is facing resistance near the $0.4780 level. There is also a key bearish trend line forming with resistance at $0.4785 on the hourly chart of the XRP/USD pair. The trend line is close to the 61.8% Fib retracement level of the downward move from the $0.4885 swing high to the $0.4619 low. The first major resistance is near the $0.4825 level. A clear move above the $0.4825 resistance might send the price toward the $0.4880 resistance. The next major resistance is near the $0.500 level. A close above the $0.500 resistance zone could send the price higher. The next key resistance is near $0.5250. Any more gains might send the price toward the $0.5500 resistance. Another Decline? If XRP fails to clear the $0.4825 resistance zone, it could start another decline. Initial support on the downside is near the $0.4680 level. The next major support is at $0.4620. If there is a downside break and a close below the $0.4620 level, the price might decline further. In the stated case, the price could even trade below the $0.450 support in the near term. Technical Indicators Hourly MACD – The MACD for XRP/USD is now gaining pace in the bullish zone. Hourly RSI (Relative Strength Index) – The RSI for XRP/USD is now above the 50 level. Major Support Levels – $0.4680 and $0.4620. Major Resistance Levels – $0.4800 and $0.4825.
XRP price extended losses and tested the $0.4620 support. The price is now recovering and might gain bullish momentum if it clears the $0.4825 resistance.
- XRP price remained in a bearish zone and tested the $0.4620 support zone.
- The price is now trading below $0.4820 and the 100-hourly Simple Moving Average.
- There is a key bearish trend line forming with resistance at $0.4785 on the hourly chart of the XRP/USD pair (data source from Kraken).
- The pair could recover steadily if there is a move above $0.4800 and $0.4820.
XRP Price Forms Support
XRP price failed to clear the $0.4820 resistance zone and started another decline like Bitcoin and Ethereum. There was a move below the $0.480 and $0.4750 levels. The price even spiked below $0.4650.
However, the bulls were active near $0.4620. A low was formed at $0.4619 and the price is now recovering losses. There was an upward move above the $0.4680 and $0.4720 resistance levels. The price cleared the 50% Fib retracement level of the downward move from the $0.4885 swing high to the $0.4619 low.
It is now trading below $0.4850 and the 100-hourly Simple Moving Average. On the upside, the price is facing resistance near the $0.4780 level. There is also a key bearish trend line forming with resistance at $0.4785 on the hourly chart of the XRP/USD pair.
The trend line is close to the 61.8% Fib retracement level of the downward move from the $0.4885 swing high to the $0.4619 low. The first major resistance is near the $0.4825 level.
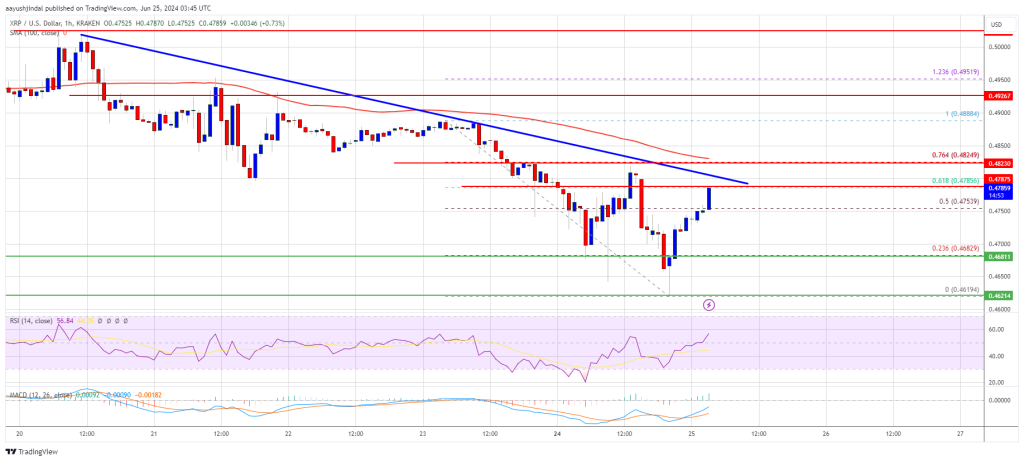
A clear move above the $0.4825 resistance might send the price toward the $0.4880 resistance. The next major resistance is near the $0.500 level. A close above the $0.500 resistance zone could send the price higher. The next key resistance is near $0.5250. Any more gains might send the price toward the $0.5500 resistance.
Another Decline?
If XRP fails to clear the $0.4825 resistance zone, it could start another decline. Initial support on the downside is near the $0.4680 level.
The next major support is at $0.4620. If there is a downside break and a close below the $0.4620 level, the price might decline further. In the stated case, the price could even trade below the $0.450 support in the near term.
Technical Indicators
Hourly MACD – The MACD for XRP/USD is now gaining pace in the bullish zone.
Hourly RSI (Relative Strength Index) – The RSI for XRP/USD is now above the 50 level.
Major Support Levels – $0.4680 and $0.4620.
Major Resistance Levels – $0.4800 and $0.4825.
What's Your Reaction?