


Bitcoin Price Regains $68K: Can Bulls Push to $70K Next?
Bitcoin price extended gains above the $68,000 resistance level. BTC bulls seem to be in action, and they might aim for a move toward the $70,000 level. Bitcoin started a fresh increase above the $66,500 resistance zone. The price is trading above $66,500 and the 100 hourly Simple moving average. There is a connecting bullish trend line forming with support at $66,500 on the hourly chart of the BTC/USD pair (data feed from Kraken). The pair might extend gains and trade above the $68,800 resistance zone. Bitcoin Price Climbs Further Higher Bitcoin price remained well-supported above the $65,500 and $66,000 resistance levels. BTC started a fresh increase and was able to clear the $66,500 resistance. There was a clear move above the $67,200 level and the price even climbed above $68,000. A high was formed at $68,531 and the price is now consolidating gains. There was a move toward the 23.6% Fib retracement level of the upward move from the $65,857 swing low to the $68,531 high. Bitcoin price is now trading above $66,500 and the 100 hourly Simple moving average. There is also a connecting bullish trend line forming with support at $66,500 on the hourly chart of the BTC/USD pair. The trend line is close to the 61.8% Fib retracement level of the upward move from the $65,857 swing low to the $68,531 high. If there is a fresh increase, the price could face resistance near the $68,500 level. The first key resistance is near the $68,800 level. A clear move above the $68,800 resistance might spark another increase in the coming sessions. The next key resistance could be $69,500. The next major hurdle sits at $70,000. A close above the $70,000 resistance might push the price further higher. In the stated case, the price could rise and test the $72,000 resistance. Are Dips Limited In BTC? If Bitcoin fails to climb above the $68,500 resistance zone, it could start a downside correction. Immediate support on the downside is near the $67,600 level. The first major support is $67,200. The next support is now near $66,500 and the trend line. Any more losses might send the price toward the $65,500 support zone in the near term. Technical indicators: Hourly MACD – The MACD is now gaining pace in the bullish zone. Hourly RSI (Relative Strength Index) – The RSI for BTC/USD is now above the 50 level. Major Support Levels – $67,200, followed by $66,500. Major Resistance Levels – $68,500, and $68,800.

Bitcoin price extended gains above the $68,000 resistance level. BTC bulls seem to be in action, and they might aim for a move toward the $70,000 level.
- Bitcoin started a fresh increase above the $66,500 resistance zone.
- The price is trading above $66,500 and the 100 hourly Simple moving average.
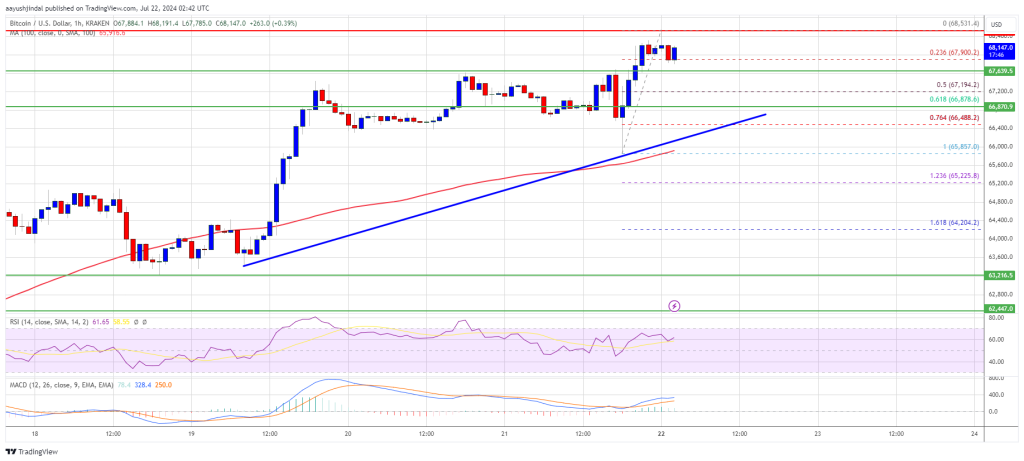
- There is a connecting bullish trend line forming with support at $66,500 on the hourly chart of the BTC/USD pair (data feed from Kraken).
- The pair might extend gains and trade above the $68,800 resistance zone.
Bitcoin Price Climbs Further Higher
Bitcoin price remained well-supported above the $65,500 and $66,000 resistance levels. BTC started a fresh increase and was able to clear the $66,500 resistance.
There was a clear move above the $67,200 level and the price even climbed above $68,000. A high was formed at $68,531 and the price is now consolidating gains. There was a move toward the 23.6% Fib retracement level of the upward move from the $65,857 swing low to the $68,531 high.
Bitcoin price is now trading above $66,500 and the 100 hourly Simple moving average. There is also a connecting bullish trend line forming with support at $66,500 on the hourly chart of the BTC/USD pair. The trend line is close to the 61.8% Fib retracement level of the upward move from the $65,857 swing low to the $68,531 high.
If there is a fresh increase, the price could face resistance near the $68,500 level. The first key resistance is near the $68,800 level. A clear move above the $68,800 resistance might spark another increase in the coming sessions.
The next key resistance could be $69,500. The next major hurdle sits at $70,000. A close above the $70,000 resistance might push the price further higher. In the stated case, the price could rise and test the $72,000 resistance.
Are Dips Limited In BTC?
If Bitcoin fails to climb above the $68,500 resistance zone, it could start a downside correction. Immediate support on the downside is near the $67,600 level.
The first major support is $67,200. The next support is now near $66,500 and the trend line. Any more losses might send the price toward the $65,500 support zone in the near term.
Technical indicators:
Hourly MACD – The MACD is now gaining pace in the bullish zone.
Hourly RSI (Relative Strength Index) – The RSI for BTC/USD is now above the 50 level.
Major Support Levels – $67,200, followed by $66,500.
Major Resistance Levels – $68,500, and $68,800.
What's Your Reaction?