


Ethereum Price Climbs: Will It Challenge the $3,700 Mark Again?
Ethereum price started a downside correction from the $3,500 resistance zone. ETH declined below $3,440 and might struggle to stay above $3,380. Ethereum is moving higher above the $3,500 zone. The price is trading above $3,520 and the 100-hourly Simple Moving Average. There is a connecting bullish trend line forming with support at $3,450 on the hourly chart of ETH/USD (data feed via Kraken). The pair could continue to rise if there is a clear move above the $3,565 resistance zone. Ethereum Price Reclaims $3,500 Ethereum price remained in a bullish zone above the $3,350 resistance zone. ETH extended its increase above the $3,500 resistance but lagged Bitcoin. There was a spike above the $3,550 level and the price traded as high as $3,563. It is now consolidating gains near the 23.6% Fib retracement level of the upward move from the $3,412 swing low to the $3,563 high. Ethereum is now trading above $3,500 and the 100-hourly Simple Moving Average. There is also a connecting bullish trend line forming with support at $3,450 on the hourly chart of ETH/USD. The trend line is close to the 76.4% Fib retracement level of the upward move from the $3,412 swing low to the $3,563 high. If the price stays above the 100-hourly Simple Moving Average, it could attempt a fresh increase. On the upside, the price is facing resistance near the $3,550 level. The first major resistance is near the $3,580 level. The next major hurdle is near the $3,650 level. A close above the $3,650 level might send Ether toward the $3,700 resistance. The next key resistance is near $3,720. An upside break above the $3,720 resistance might send the price higher toward the $3,800 resistance zone in the coming days. Another Decline In ETH? If Ethereum fails to clear the $3,550 resistance, it could start a downside correction. Initial support on the downside is near $3,500. The first major support sits near the $3,470 zone and the 100-hourly Simple Moving Average. A clear move below the $3,470 support might push the price toward $3,440. Any more losses might send the price toward the $3,350 support level in the near term. The next key support sits at $3,320. Technical Indicators Hourly MACD – The MACD for ETH/USD is losing momentum in the bullish zone. Hourly RSI – The RSI for ETH/USD is now above the 50 zone. Major Support Level – $3,500 Major Resistance Level – $3,550

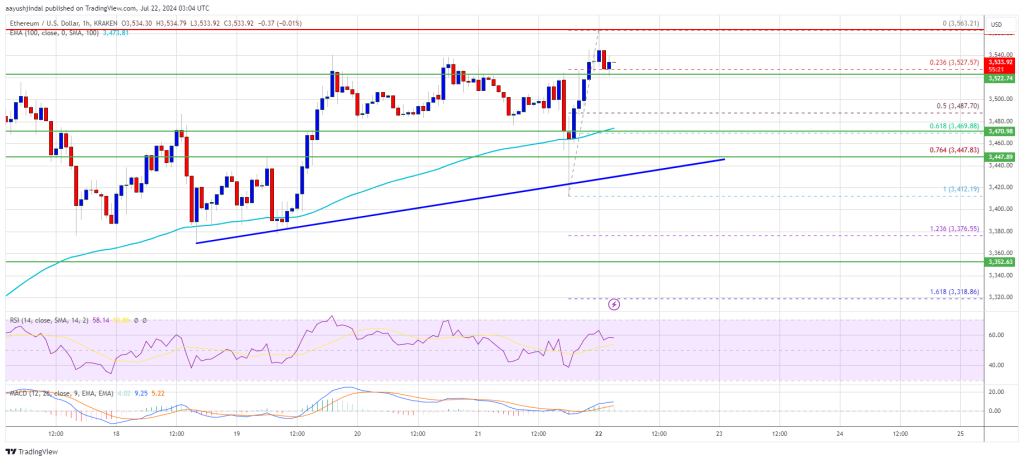
Ethereum price started a downside correction from the $3,500 resistance zone. ETH declined below $3,440 and might struggle to stay above $3,380.
- Ethereum is moving higher above the $3,500 zone.
- The price is trading above $3,520 and the 100-hourly Simple Moving Average.
- There is a connecting bullish trend line forming with support at $3,450 on the hourly chart of ETH/USD (data feed via Kraken).
- The pair could continue to rise if there is a clear move above the $3,565 resistance zone.
Ethereum Price Reclaims $3,500
Ethereum price remained in a bullish zone above the $3,350 resistance zone. ETH extended its increase above the $3,500 resistance but lagged Bitcoin. There was a spike above the $3,550 level and the price traded as high as $3,563.
It is now consolidating gains near the 23.6% Fib retracement level of the upward move from the $3,412 swing low to the $3,563 high. Ethereum is now trading above $3,500 and the 100-hourly Simple Moving Average.
There is also a connecting bullish trend line forming with support at $3,450 on the hourly chart of ETH/USD. The trend line is close to the 76.4% Fib retracement level of the upward move from the $3,412 swing low to the $3,563 high.
If the price stays above the 100-hourly Simple Moving Average, it could attempt a fresh increase. On the upside, the price is facing resistance near the $3,550 level. The first major resistance is near the $3,580 level. The next major hurdle is near the $3,650 level.
A close above the $3,650 level might send Ether toward the $3,700 resistance. The next key resistance is near $3,720. An upside break above the $3,720 resistance might send the price higher toward the $3,800 resistance zone in the coming days.
Another Decline In ETH?
If Ethereum fails to clear the $3,550 resistance, it could start a downside correction. Initial support on the downside is near $3,500. The first major support sits near the $3,470 zone and the 100-hourly Simple Moving Average.
A clear move below the $3,470 support might push the price toward $3,440. Any more losses might send the price toward the $3,350 support level in the near term. The next key support sits at $3,320.
Technical Indicators
Hourly MACD – The MACD for ETH/USD is losing momentum in the bullish zone.
Hourly RSI – The RSI for ETH/USD is now above the 50 zone.
Major Support Level – $3,500
Major Resistance Level – $3,550
What's Your Reaction?