XRP Price Eyes Upside Break: Will The Gains Keep Rolling?
XRP price started a fresh increase from the $0.540 zone. The price is now rising and eyeing an upside break above the $0.600 resistance zone. XRP price started a fresh increase above the $0.580 zone. The price is now trading above $0.580 and the 100-hourly Simple Moving Average. There is a key contracting triangle forming with support at $0.5880 on the hourly chart of the XRP/USD pair (data source from Kraken). The pair could extend gain bullish momentum if it clears the $0.60 resistance zone. XRP Price Eyes More Upsides XRP price remained stable above the $0.540 level and started a fresh increase. There was a move above the $0.5650 and $0.5720 resistance levels but lagged Ethereum and Bitcoin. The price climbed above the 50% Fib retracement level of the downward move from the $0.6374 swing high to the $0.5404 low. The current price action is positive above the 100-hourly Simple Moving Average, but the bulls are now facing resistance near the $0.600 level. There is also a key contracting triangle forming with support at $0.5880 on the hourly chart of the XRP/USD pair. The pair is now trading above $0.5880 and the 100-hourly Simple Moving Average. If there is a fresh upward move, the price could face resistance near the $0.600 level. The first major resistance is near the $0.6150 level. The next key resistance could be $0.6370. A clear move above the $0.6370 resistance might send the price toward the $0.650 resistance. The next major resistance is near the $0.6665 level. Any more gains might send the price toward the $0.680 resistance. Another Drop? If XRP fails to clear the $0.600 resistance zone, it could start another decline. Initial support on the downside is near the $0.5880 level and the triangle lower trend line. The next major support is at $0.5650. If there is a downside break and a close below the $0.5650 level, the price might continue to decline toward the $0.540 support in the near term. Technical Indicators Hourly MACD – The MACD for XRP/USD is now gaining pace in the bullish zone. Hourly RSI (Relative Strength Index) – The RSI for XRP/USD is now above the 50 level. Major Support Levels – $0.5880 and $0.5650. Major Resistance Levels – $0.6000 and $0.6150.

XRP price started a fresh increase from the $0.540 zone. The price is now rising and eyeing an upside break above the $0.600 resistance zone.
- XRP price started a fresh increase above the $0.580 zone.
- The price is now trading above $0.580 and the 100-hourly Simple Moving Average.
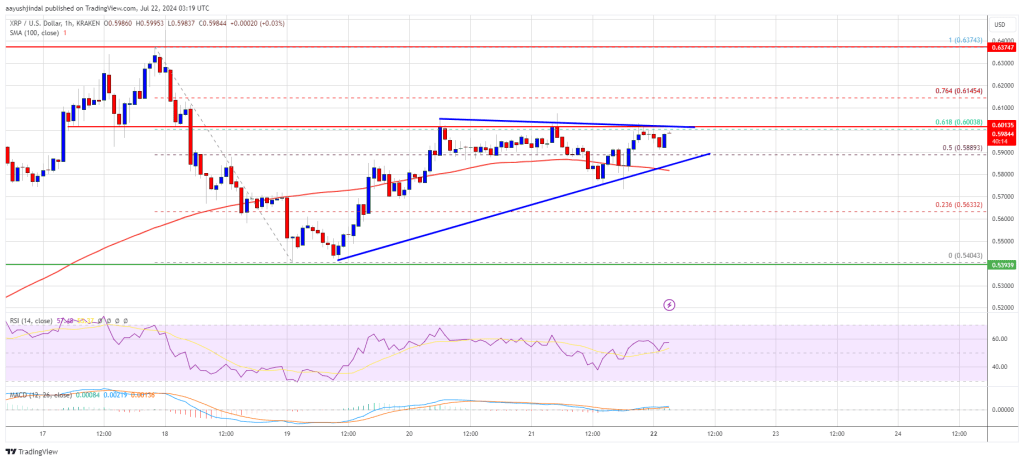
- There is a key contracting triangle forming with support at $0.5880 on the hourly chart of the XRP/USD pair (data source from Kraken).
- The pair could extend gain bullish momentum if it clears the $0.60 resistance zone.
XRP Price Eyes More Upsides
XRP price remained stable above the $0.540 level and started a fresh increase. There was a move above the $0.5650 and $0.5720 resistance levels but lagged Ethereum and Bitcoin.
The price climbed above the 50% Fib retracement level of the downward move from the $0.6374 swing high to the $0.5404 low. The current price action is positive above the 100-hourly Simple Moving Average, but the bulls are now facing resistance near the $0.600 level.
There is also a key contracting triangle forming with support at $0.5880 on the hourly chart of the XRP/USD pair. The pair is now trading above $0.5880 and the 100-hourly Simple Moving Average.
If there is a fresh upward move, the price could face resistance near the $0.600 level. The first major resistance is near the $0.6150 level. The next key resistance could be $0.6370. A clear move above the $0.6370 resistance might send the price toward the $0.650 resistance. The next major resistance is near the $0.6665 level. Any more gains might send the price toward the $0.680 resistance.
Another Drop?
If XRP fails to clear the $0.600 resistance zone, it could start another decline. Initial support on the downside is near the $0.5880 level and the triangle lower trend line. The next major support is at $0.5650.
If there is a downside break and a close below the $0.5650 level, the price might continue to decline toward the $0.540 support in the near term.
Technical Indicators
Hourly MACD – The MACD for XRP/USD is now gaining pace in the bullish zone.
Hourly RSI (Relative Strength Index) – The RSI for XRP/USD is now above the 50 level.
Major Support Levels – $0.5880 and $0.5650.
Major Resistance Levels – $0.6000 and $0.6150.
What's Your Reaction?