Dogecoin Price (DOGE) Slips Alongside Bitcoin and Ethereum: Market Analysis
Dogecoin started a major decline below the $0.1150 zone against the US Dollar. DOGE is now trading below $0.100 and showing many bearish signs. DOGE price is down over 15% from well above the $0.1200 pivot zone. The price is trading below the $0.100 level and the 100-hourly simple moving average. There is a key bearish trend line forming with resistance at $0.1000 on the hourly chart of the DOGE/USD pair (data source from Kraken). The price could continue to move down unless it reclaims the $0.100 resistance zone. Dogecoin Price Drops Over 15% In the past few sessions, Dogecoin price saw a major decline like Bitcoin and Ethereum. The bears took control and pushed the price below the $0.1120 and $0.1050 support levels. The price even declined below the $0.1000 support. A low was formed at $0.0881 and DOGE price is now consolidating losses. The price is showing many bearish signs below the 23.6% Fib retracement level of the downward move from the $0.1194 swing high to the $0.0881 low. Dogecoin is now trading below the $0.100 level and the 100-hourly simple moving average. Immediate resistance on the upside is near the $0.0950 level. The next major resistance is near the $0.1000 level. There is also a key bearish trend line forming with resistance at $0.1000 on the hourly chart of the DOGE/USD pair. A close above the $0.100 resistance might send the price toward the $0.1040 resistance or the 50% Fib retracement level of the downward move from the $0.1194 swing high to the $0.0881 low. Any more gains might send the price toward the $0.1080 level. The next major stop for the bulls might be $0.1120. More Downsides In DOGE? If DOGE’s price fails to recover above the $0.1000 level, it could start another decline. Initial support on the downside is near the $0.0880 level. The next major support is near the $0.0850 level. The main support sits at $0.0780. If there is a downside break below the $0.0780 support, the price could decline further. In the stated case, the price might decline toward the $0.0720 level. Technical Indicators Hourly MACD – The MACD for DOGE/USD is now gaining momentum in the bearish zone. Hourly RSI (Relative Strength Index) – The RSI for DOGE/USD is now below the 50 level. Major Support Levels – $0.0880 and $0.0780. Major Resistance Levels – $0.0950 and $0.1000.

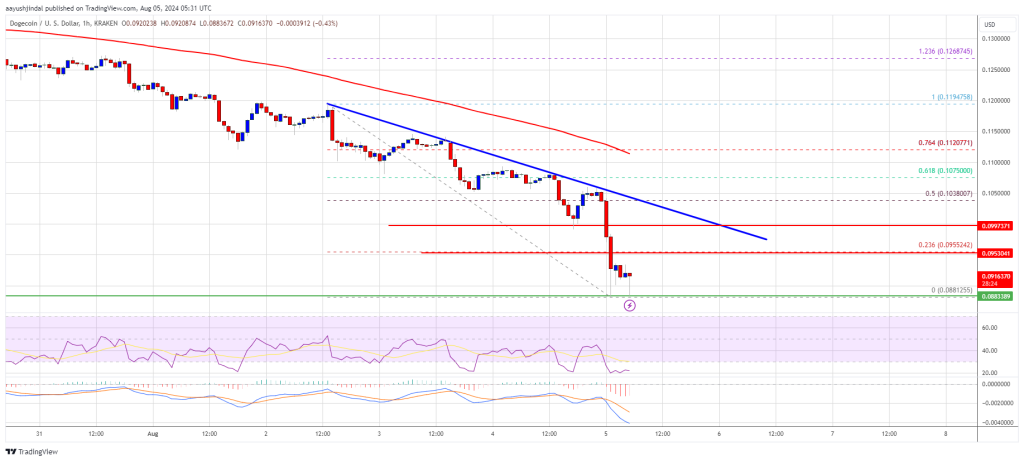
Dogecoin started a major decline below the $0.1150 zone against the US Dollar. DOGE is now trading below $0.100 and showing many bearish signs.
- DOGE price is down over 15% from well above the $0.1200 pivot zone.
- The price is trading below the $0.100 level and the 100-hourly simple moving average.
- There is a key bearish trend line forming with resistance at $0.1000 on the hourly chart of the DOGE/USD pair (data source from Kraken).
- The price could continue to move down unless it reclaims the $0.100 resistance zone.
Dogecoin Price Drops Over 15%
In the past few sessions, Dogecoin price saw a major decline like Bitcoin and Ethereum. The bears took control and pushed the price below the $0.1120 and $0.1050 support levels.
The price even declined below the $0.1000 support. A low was formed at $0.0881 and DOGE price is now consolidating losses. The price is showing many bearish signs below the 23.6% Fib retracement level of the downward move from the $0.1194 swing high to the $0.0881 low.
Dogecoin is now trading below the $0.100 level and the 100-hourly simple moving average. Immediate resistance on the upside is near the $0.0950 level. The next major resistance is near the $0.1000 level. There is also a key bearish trend line forming with resistance at $0.1000 on the hourly chart of the DOGE/USD pair.
A close above the $0.100 resistance might send the price toward the $0.1040 resistance or the 50% Fib retracement level of the downward move from the $0.1194 swing high to the $0.0881 low. Any more gains might send the price toward the $0.1080 level. The next major stop for the bulls might be $0.1120.
More Downsides In DOGE?
If DOGE’s price fails to recover above the $0.1000 level, it could start another decline. Initial support on the downside is near the $0.0880 level. The next major support is near the $0.0850 level.
The main support sits at $0.0780. If there is a downside break below the $0.0780 support, the price could decline further. In the stated case, the price might decline toward the $0.0720 level.
Technical Indicators
Hourly MACD – The MACD for DOGE/USD is now gaining momentum in the bearish zone.
Hourly RSI (Relative Strength Index) – The RSI for DOGE/USD is now below the 50 level.
Major Support Levels – $0.0880 and $0.0780.
Major Resistance Levels – $0.0950 and $0.1000.
What's Your Reaction?