


XRP Price Falls Below $0.50: Key Takeaways for the Market
XRP price is down over 15% and trading below $0.50. The price is showing bearish signs and might struggle to recover above the $0.520 resistance. XRP price traded below the $0.500 and $0.4850 support levels. The price is now trading below $0.4880 and the 100-hourly Simple Moving Average. There is a key bearish trend line forming with resistance at $0.5180 on the hourly chart of the XRP/USD pair (data source from Kraken). The pair could attempt a steady recovery wave if it clears the $0.520 resistance zone. XRP Price Dives Over 15% XRP price started a major decline below the $0.500 support after Ethereum and Bitcoin nosedived. There was a major decline below the $0.4850 support zone. The price tested the $0.460 zone. A low is formed at $0.460 and the price is now consolidating losses. It is showing a lot of bearish signs below the 23.6% Fib retracement level of the downward move from the $0.5767 swing high to the $0.460 low. The price is now trading below $0.5880 and the 100-hourly Simple Moving Average. There is also a key bearish trend line forming with resistance at $0.5180 on the hourly chart of the XRP/USD pair. If there is a recovery wave, the price could face resistance near the $0.4880 level. The first major resistance is near the $0.500 level. The next key resistance could be $0.5180 or the trend line or the 50% Fib retracement level of the downward move from the $0.5767 swing high to the $0.460 low. A clear move above the $0.520 resistance might send the price toward the $0.5350 resistance. The next major resistance is near the $0.5440 level. Any more gains might send the price toward the $0.550 resistance or even $0.5650 in the near term. More Downsides? If XRP fails to clear the $0.520 resistance zone, it could continue to move down. Initial support on the downside is near the $0.4650 level. The next major support is at $0.460. If there is a downside break and a close below the $0.460 level, the price might continue to decline toward the $0.4350 support in the near term. The next major support sits at $0.4250. Technical Indicators Hourly MACD – The MACD for XRP/USD is now gaining pace in the bearish zone. Hourly RSI (Relative Strength Index) – The RSI for XRP/USD is now below the 50 level. Major Support Levels – $0.4600 and $0.4500. Major Resistance Levels – $0.5000 and $0.5200.

XRP price is down over 15% and trading below $0.50. The price is showing bearish signs and might struggle to recover above the $0.520 resistance.
- XRP price traded below the $0.500 and $0.4850 support levels.
- The price is now trading below $0.4880 and the 100-hourly Simple Moving Average.
- There is a key bearish trend line forming with resistance at $0.5180 on the hourly chart of the XRP/USD pair (data source from Kraken).
- The pair could attempt a steady recovery wave if it clears the $0.520 resistance zone.
XRP Price Dives Over 15%
XRP price started a major decline below the $0.500 support after Ethereum and Bitcoin nosedived. There was a major decline below the $0.4850 support zone.
The price tested the $0.460 zone. A low is formed at $0.460 and the price is now consolidating losses. It is showing a lot of bearish signs below the 23.6% Fib retracement level of the downward move from the $0.5767 swing high to the $0.460 low.
The price is now trading below $0.5880 and the 100-hourly Simple Moving Average. There is also a key bearish trend line forming with resistance at $0.5180 on the hourly chart of the XRP/USD pair. If there is a recovery wave, the price could face resistance near the $0.4880 level.
The first major resistance is near the $0.500 level. The next key resistance could be $0.5180 or the trend line or the 50% Fib retracement level of the downward move from the $0.5767 swing high to the $0.460 low. A clear move above the $0.520 resistance might send the price toward the $0.5350 resistance.
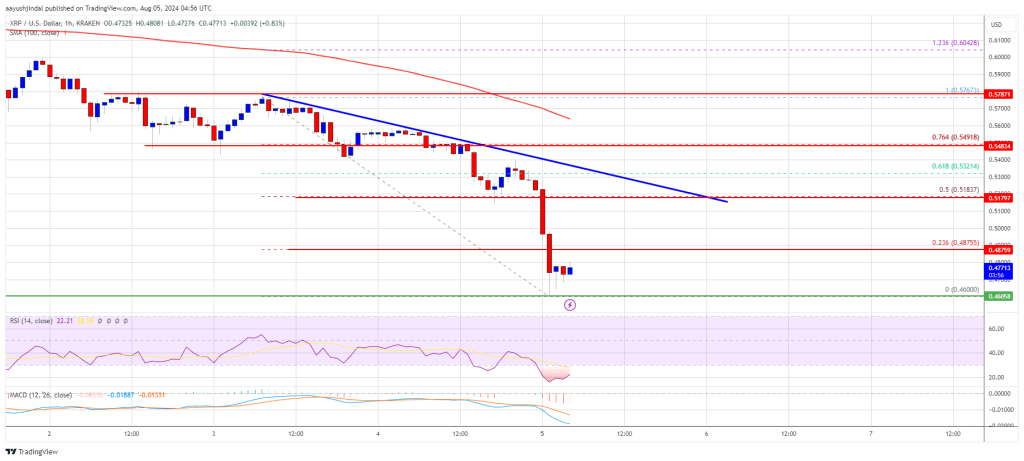
The next major resistance is near the $0.5440 level. Any more gains might send the price toward the $0.550 resistance or even $0.5650 in the near term.
More Downsides?
If XRP fails to clear the $0.520 resistance zone, it could continue to move down. Initial support on the downside is near the $0.4650 level. The next major support is at $0.460.
If there is a downside break and a close below the $0.460 level, the price might continue to decline toward the $0.4350 support in the near term. The next major support sits at $0.4250.
Technical Indicators
Hourly MACD – The MACD for XRP/USD is now gaining pace in the bearish zone.
Hourly RSI (Relative Strength Index) – The RSI for XRP/USD is now below the 50 level.
Major Support Levels – $0.4600 and $0.4500.
Major Resistance Levels – $0.5000 and $0.5200.
What's Your Reaction?