


Ethereum Dives Below $3K: What’s Next For The Crypto?
Ethereum price remained in a bearish zone below $3,250 zone. ETH dived below the $3,000 support and even tested the $2,850 zone. Ethereum started a fresh decline below the $3,120 and $3,000 levels. The price is trading below $3,000 and the 100-hourly Simple Moving Average. There is a key bearish trend line forming with resistance near $3,000 on the hourly chart of ETH/USD (data feed via Kraken). The pair could correct losses, but upsides might be limited above the $3,120 zone. Ethereum Price Dives 8% Ethereum price failed to start a recovery wave above the $3,150 and $3,200 resistance levels. ETH started another decline below the $3,120 support zone like Bitcoin. There was a move below the $3,050 and $3,000 support levels. The price declined 8% and even tested the $2,850 support. A low was formed at $2,862 and the price is now consolidating losses. The price is showing a lot of bearish signs and trading well below the 23.6% Fib retracement level of the downward move from the $3,425 swing high to the $2,860 low. Ethereum is trading below $3,000 and the 100-hourly Simple Moving Average. If there is a recovery wave, the price might face resistance near the $2,960 level. The first major resistance is near the $3,000 level. There is also a key bearish trend line forming with resistance near $3,000 on the hourly chart of ETH/USD. The next major hurdle is near the $3,120 level or the 50% Fib retracement level of the downward move from the $3,425 swing high to the $2,860 low. A close above the $3,120 level might send Ether toward the $3,200 resistance. The next key resistance is near $3,250. An upside break above the $3,250 resistance might send the price higher toward the $3,350 resistance zone. More Losses In ETH? If Ethereum fails to clear the $3,000 resistance, it could continue to move down. Initial support on the downside is near $2,850. The first major support sits near the $2,800 zone. A clear move below the $2,800 support might push the price toward $2,720. Any more losses might send the price toward the $2,650 level in the near term. Technical Indicators Hourly MACD – The MACD for ETH/USD is gaining momentum in the bearish zone. Hourly RSI – The RSI for ETH/USD is now below the 50 zone. Major Support Level – $2,850 Major Resistance Level – $3,000

Ethereum price remained in a bearish zone below $3,250 zone. ETH dived below the $3,000 support and even tested the $2,850 zone.
- Ethereum started a fresh decline below the $3,120 and $3,000 levels.
- The price is trading below $3,000 and the 100-hourly Simple Moving Average.
- There is a key bearish trend line forming with resistance near $3,000 on the hourly chart of ETH/USD (data feed via Kraken).
- The pair could correct losses, but upsides might be limited above the $3,120 zone.
Ethereum Price Dives 8%
Ethereum price failed to start a recovery wave above the $3,150 and $3,200 resistance levels. ETH started another decline below the $3,120 support zone like Bitcoin. There was a move below the $3,050 and $3,000 support levels.
The price declined 8% and even tested the $2,850 support. A low was formed at $2,862 and the price is now consolidating losses. The price is showing a lot of bearish signs and trading well below the 23.6% Fib retracement level of the downward move from the $3,425 swing high to the $2,860 low.
Ethereum is trading below $3,000 and the 100-hourly Simple Moving Average. If there is a recovery wave, the price might face resistance near the $2,960 level. The first major resistance is near the $3,000 level.
There is also a key bearish trend line forming with resistance near $3,000 on the hourly chart of ETH/USD. The next major hurdle is near the $3,120 level or the 50% Fib retracement level of the downward move from the $3,425 swing high to the $2,860 low.
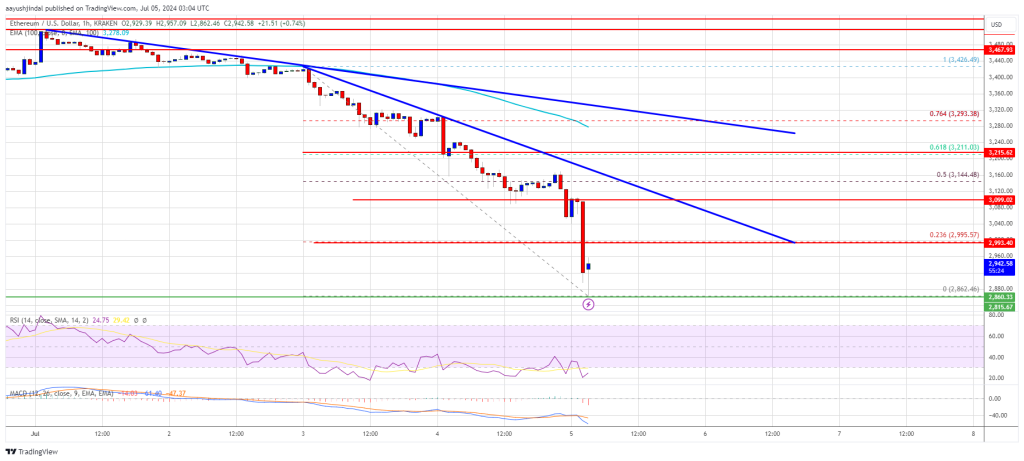
A close above the $3,120 level might send Ether toward the $3,200 resistance. The next key resistance is near $3,250. An upside break above the $3,250 resistance might send the price higher toward the $3,350 resistance zone.
More Losses In ETH?
If Ethereum fails to clear the $3,000 resistance, it could continue to move down. Initial support on the downside is near $2,850. The first major support sits near the $2,800 zone.
A clear move below the $2,800 support might push the price toward $2,720. Any more losses might send the price toward the $2,650 level in the near term.
Technical Indicators
Hourly MACD – The MACD for ETH/USD is gaining momentum in the bearish zone.
Hourly RSI – The RSI for ETH/USD is now below the 50 zone.
Major Support Level – $2,850
Major Resistance Level – $3,000
What's Your Reaction?