


XRP Price Crashes 15%, Slips Under $0.40: Difficult Recovery Ahead
XRP price tumbled and dived below the $0.400 support zone. The price is consolidating losses and might struggle to recover above the $0.4150 resistance. XRP price gained bearish momentum below the $0.4240 support zone. The price is now trading below $0.4250 and the 100-hourly Simple Moving Average. There is a key bearish trend line forming with resistance at $0.4150 on the hourly chart of the XRP/USD pair (data source from Kraken). The pair might recover, but the upsides might be limited above $0.4050 and $0.4150. XRP Price Takes Hit XRP price struggled to clear the $0.4550 resistance and started a fresh decline, like Bitcoin and Ethereum. The bears took control and pushed the price below the $0.4240 support. The pair even declined heavily below the $0.4150 support level. Finally, it even spiked below the $0.400 support. A low was formed at $0.3826 and the price is now correcting losses. There was a recovery wave above the $0.3920 resistance. The price climbed above the 23.6% Fib retracement level of the recent decline from the $0.4467 swing high to the $0.3862 low. It is now trading below $0.4250 and the 100-hourly Simple Moving Average. On the upside, the price is facing resistance near the $0.4050 level. The first major resistance is near the $0.4150 level and the 50% Fib retracement level of the recent decline from the $0.4467 swing high to the $0.3862 low. There is also a key bearish trend line forming with resistance at $0.4150 on the hourly chart of the XRP/USD pair. The next key resistance could be $0.4220. A clear move above the $0.4220 resistance might send the price toward the $0.4380 resistance. The next major resistance is near the $0.4450 level. Any more gains might send the price toward the $0.4650 resistance. More Losses? If XRP fails to clear the $0.4150 resistance zone, it could start another decline. Initial support on the downside is near the $0.390 level. The next major support is at $0.3850. If there is a downside break and a close below the $0.3850 level, the price might continue to decline toward the $0.3620 support in the near term. Technical Indicators Hourly MACD – The MACD for XRP/USD is now gaining pace in the bearish zone. Hourly RSI (Relative Strength Index) – The RSI for XRP/USD is now below the 50 level. Major Support Levels – $0.390 and $0.3850. Major Resistance Levels – $0.4050 and $0.4150.

XRP price tumbled and dived below the $0.400 support zone. The price is consolidating losses and might struggle to recover above the $0.4150 resistance.
- XRP price gained bearish momentum below the $0.4240 support zone.
- The price is now trading below $0.4250 and the 100-hourly Simple Moving Average.
- There is a key bearish trend line forming with resistance at $0.4150 on the hourly chart of the XRP/USD pair (data source from Kraken).
- The pair might recover, but the upsides might be limited above $0.4050 and $0.4150.
XRP Price Takes Hit
XRP price struggled to clear the $0.4550 resistance and started a fresh decline, like Bitcoin and Ethereum. The bears took control and pushed the price below the $0.4240 support.
The pair even declined heavily below the $0.4150 support level. Finally, it even spiked below the $0.400 support. A low was formed at $0.3826 and the price is now correcting losses. There was a recovery wave above the $0.3920 resistance.
The price climbed above the 23.6% Fib retracement level of the recent decline from the $0.4467 swing high to the $0.3862 low. It is now trading below $0.4250 and the 100-hourly Simple Moving Average.
On the upside, the price is facing resistance near the $0.4050 level. The first major resistance is near the $0.4150 level and the 50% Fib retracement level of the recent decline from the $0.4467 swing high to the $0.3862 low. There is also a key bearish trend line forming with resistance at $0.4150 on the hourly chart of the XRP/USD pair.
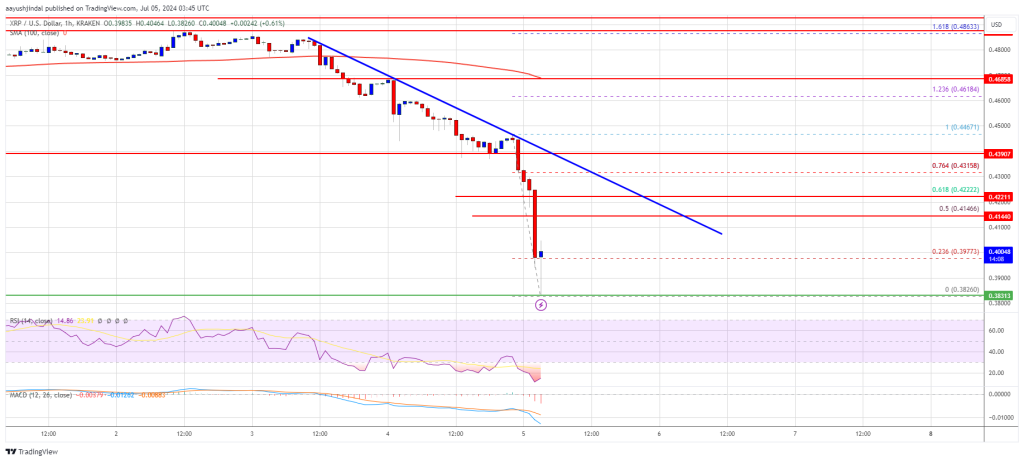
The next key resistance could be $0.4220. A clear move above the $0.4220 resistance might send the price toward the $0.4380 resistance. The next major resistance is near the $0.4450 level. Any more gains might send the price toward the $0.4650 resistance.
More Losses?
If XRP fails to clear the $0.4150 resistance zone, it could start another decline. Initial support on the downside is near the $0.390 level.
The next major support is at $0.3850. If there is a downside break and a close below the $0.3850 level, the price might continue to decline toward the $0.3620 support in the near term.
Technical Indicators
Hourly MACD – The MACD for XRP/USD is now gaining pace in the bearish zone.
Hourly RSI (Relative Strength Index) – The RSI for XRP/USD is now below the 50 level.
Major Support Levels – $0.390 and $0.3850.
Major Resistance Levels – $0.4050 and $0.4150.
What's Your Reaction?