


Ethereum Price Pulls Back: Can It Rebound and Remain Attractive?
Ethereum price is correcting gains from the $2,820 resistance. ETH could start another increase unless there is a close below the $2,645 support. Ethereum is correcting gains below the $2,780 and $2,750 levels. The price is trading below $2,720 and the 100-hourly Simple Moving Average. There was a break below a key bullish trend line with support at $2,740 on the hourly chart of ETH/USD (data feed via Kraken). The pair could find bids near the $2,650 and $2,645 levels. Ethereum Price Starts Downside Correction Ethereum price extended its increase above the $2,750 resistance level. ETH even climbed above $2,800 before the bears appeared. A high was formed at $2,820 and the price started a downside correction like Bitcoin. There was a move below the $2,780 level. The price declined below the 50% Fib retracement level of the upward wave from the $2,535 swing low to the $2,820 high. Besides, there was a break below a key bullish trend line with support at $2,740 on the hourly chart of ETH/USD. Ethereum price is now trading below $2,740 and the 100-hourly Simple Moving Average. However, the bulls are likely to remain active near the $2,645 support. It is close to the 61.8% Fib retracement level of the upward wave from the $2,535 swing low to the $2,820 high. If there is another increase, the price might face hurdles near the $2,720 level. The first major resistance is near the $2,740 level. A close above the $2,740 level might send Ether toward the $2,820 resistance. The next key resistance is near $2,880. An upside break above the $2,880 resistance might send the price higher toward the $3,000 resistance zone in the near term. More Downsides In ETH? If Ethereum fails to clear the $2,740 resistance, it could continue to move down. Initial support on the downside is near $2,645. The first major support sits near the $2,600 zone. A clear move below the $2,600 support might push the price toward $2,550 where the bulls could emerge. Any more losses might send the price toward the $2,500 support level in the near term. The next key support sits at $2,440. Technical Indicators Hourly MACD – The MACD for ETH/USD is gaining momentum in the bearish zone. Hourly RSI – The RSI for ETH/USD is now below the 50 zone. Major Support Level – $2,645 Major Resistance Level – $2,740

Ethereum price is correcting gains from the $2,820 resistance. ETH could start another increase unless there is a close below the $2,645 support.
- Ethereum is correcting gains below the $2,780 and $2,750 levels.
- The price is trading below $2,720 and the 100-hourly Simple Moving Average.
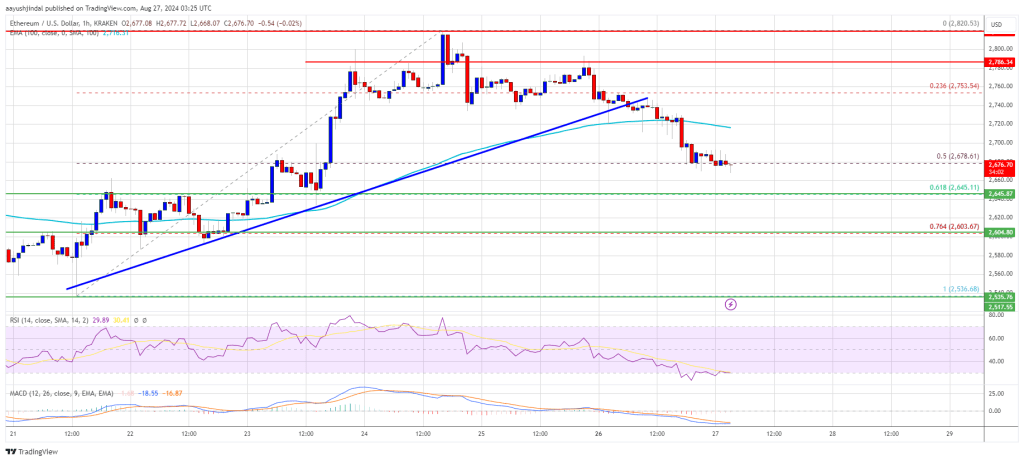
- There was a break below a key bullish trend line with support at $2,740 on the hourly chart of ETH/USD (data feed via Kraken).
- The pair could find bids near the $2,650 and $2,645 levels.
Ethereum Price Starts Downside Correction
Ethereum price extended its increase above the $2,750 resistance level. ETH even climbed above $2,800 before the bears appeared. A high was formed at $2,820 and the price started a downside correction like Bitcoin.
There was a move below the $2,780 level. The price declined below the 50% Fib retracement level of the upward wave from the $2,535 swing low to the $2,820 high. Besides, there was a break below a key bullish trend line with support at $2,740 on the hourly chart of ETH/USD.
Ethereum price is now trading below $2,740 and the 100-hourly Simple Moving Average. However, the bulls are likely to remain active near the $2,645 support. It is close to the 61.8% Fib retracement level of the upward wave from the $2,535 swing low to the $2,820 high.
If there is another increase, the price might face hurdles near the $2,720 level. The first major resistance is near the $2,740 level. A close above the $2,740 level might send Ether toward the $2,820 resistance. The next key resistance is near $2,880. An upside break above the $2,880 resistance might send the price higher toward the $3,000 resistance zone in the near term.
More Downsides In ETH?
If Ethereum fails to clear the $2,740 resistance, it could continue to move down. Initial support on the downside is near $2,645. The first major support sits near the $2,600 zone.
A clear move below the $2,600 support might push the price toward $2,550 where the bulls could emerge. Any more losses might send the price toward the $2,500 support level in the near term. The next key support sits at $2,440.
Technical Indicators
Hourly MACD – The MACD for ETH/USD is gaining momentum in the bearish zone.
Hourly RSI – The RSI for ETH/USD is now below the 50 zone.
Major Support Level – $2,645
Major Resistance Level – $2,740
What's Your Reaction?