


XRP Price Flashes Breakout Signal: Are Short-Term Gains Coming?
XRP price is attempting a fresh increase from the $0.5785 support zone. The price could gain bullish pace if it clears the $0.60 resistance. XRP price is eyeing a fresh increase from the $0.5785 level. The price is now trading below $0.600 and the 100-hourly Simple Moving Average. There was a break above a connecting bearish trend line with resistance at $0.590 on the hourly chart of the XRP/USD pair (data source from Kraken). The pair could gain momentum if it clears the $0.600 and $0.6050 resistance levels. XRP Price Aims Steady Increase XRP price extended its decline below the $0.5920 support. It tested the $0.5785 zone. A low was formed at $0.5788 and the price is now attempting a fresh increase unlike Bitcoin and Ethereum. There was a move above the $0.5850 and $0.5880 levels. The price cleared the 23.6% Fib retracement level of the downward move from the $0.6306 swing high to the $0.5788 low. Besides, there was a break above a connecting bearish trend line with resistance at $0.590 on the hourly chart of the XRP/USD pair. The price is still trading below $0.600 and the 100-hourly Simple Moving Average. On the upside, the price might face resistance near the $0.600 level. The first major resistance is near the $0.6020 level. The next key resistance could be $0.6050 or the 50% Fib retracement level of the downward move from the $0.6306 swing high to the $0.5788 low. A clear move above the $0.6050 resistance might send the price toward the $0.6160 resistance. The next major resistance is near the $0.6250 level. Any more gains might send the price toward the $0.6350 resistance or even $0.650 in the near term. Another Decline? If XRP fails to clear the $0.60 resistance zone, it could start another decline. Initial support on the downside is near the $0.5850 level. The next major support is at $0.5785. If there is a downside break and a close below the $0.5785 level, the price might continue to decline toward the $0.550 support in the near term. The next major support sits at $0.5320. Technical Indicators Hourly MACD – The MACD for XRP/USD is now losing pace in the bearish zone. Hourly RSI (Relative Strength Index) – The RSI for XRP/USD is now above the 50 level. Major Support Levels – $0.5850 and $0.5785. Major Resistance Levels – $0.6000 and $0.6050.

XRP price is attempting a fresh increase from the $0.5785 support zone. The price could gain bullish pace if it clears the $0.60 resistance.
- XRP price is eyeing a fresh increase from the $0.5785 level.
- The price is now trading below $0.600 and the 100-hourly Simple Moving Average.
- There was a break above a connecting bearish trend line with resistance at $0.590 on the hourly chart of the XRP/USD pair (data source from Kraken).
- The pair could gain momentum if it clears the $0.600 and $0.6050 resistance levels.
XRP Price Aims Steady Increase
XRP price extended its decline below the $0.5920 support. It tested the $0.5785 zone. A low was formed at $0.5788 and the price is now attempting a fresh increase unlike Bitcoin and Ethereum.
There was a move above the $0.5850 and $0.5880 levels. The price cleared the 23.6% Fib retracement level of the downward move from the $0.6306 swing high to the $0.5788 low. Besides, there was a break above a connecting bearish trend line with resistance at $0.590 on the hourly chart of the XRP/USD pair.
The price is still trading below $0.600 and the 100-hourly Simple Moving Average. On the upside, the price might face resistance near the $0.600 level. The first major resistance is near the $0.6020 level.
The next key resistance could be $0.6050 or the 50% Fib retracement level of the downward move from the $0.6306 swing high to the $0.5788 low. A clear move above the $0.6050 resistance might send the price toward the $0.6160 resistance.
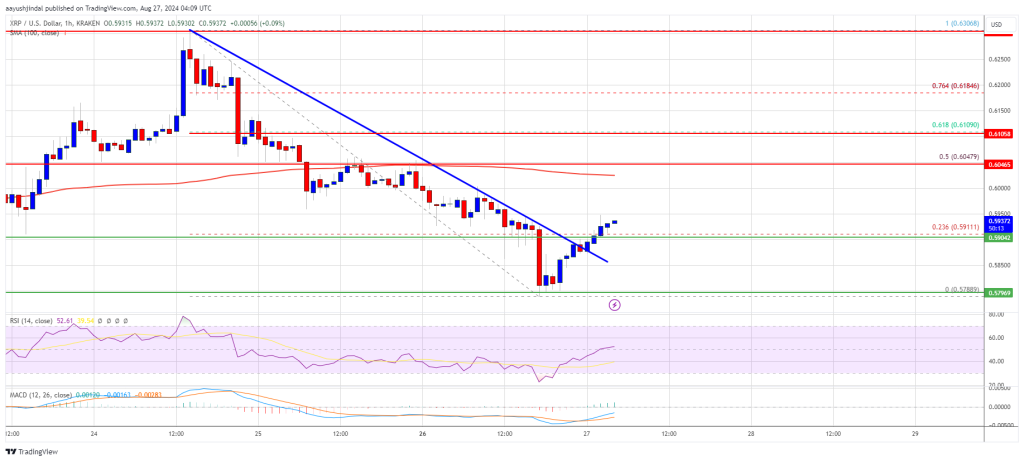
The next major resistance is near the $0.6250 level. Any more gains might send the price toward the $0.6350 resistance or even $0.650 in the near term.
Another Decline?
If XRP fails to clear the $0.60 resistance zone, it could start another decline. Initial support on the downside is near the $0.5850 level. The next major support is at $0.5785.
If there is a downside break and a close below the $0.5785 level, the price might continue to decline toward the $0.550 support in the near term. The next major support sits at $0.5320.
Technical Indicators
Hourly MACD – The MACD for XRP/USD is now losing pace in the bearish zone.
Hourly RSI (Relative Strength Index) – The RSI for XRP/USD is now above the 50 level.
Major Support Levels – $0.5850 and $0.5785.
Major Resistance Levels – $0.6000 and $0.6050.
What's Your Reaction?